 9
9peptides
spectra
0.000 | 0.000
0.000 | 0.000
0.016 | 0.074
0.176 | 0.285
0.000 | 0.132
0.321 | 0.434
0.238 | 0.277
0.000 | 0.000
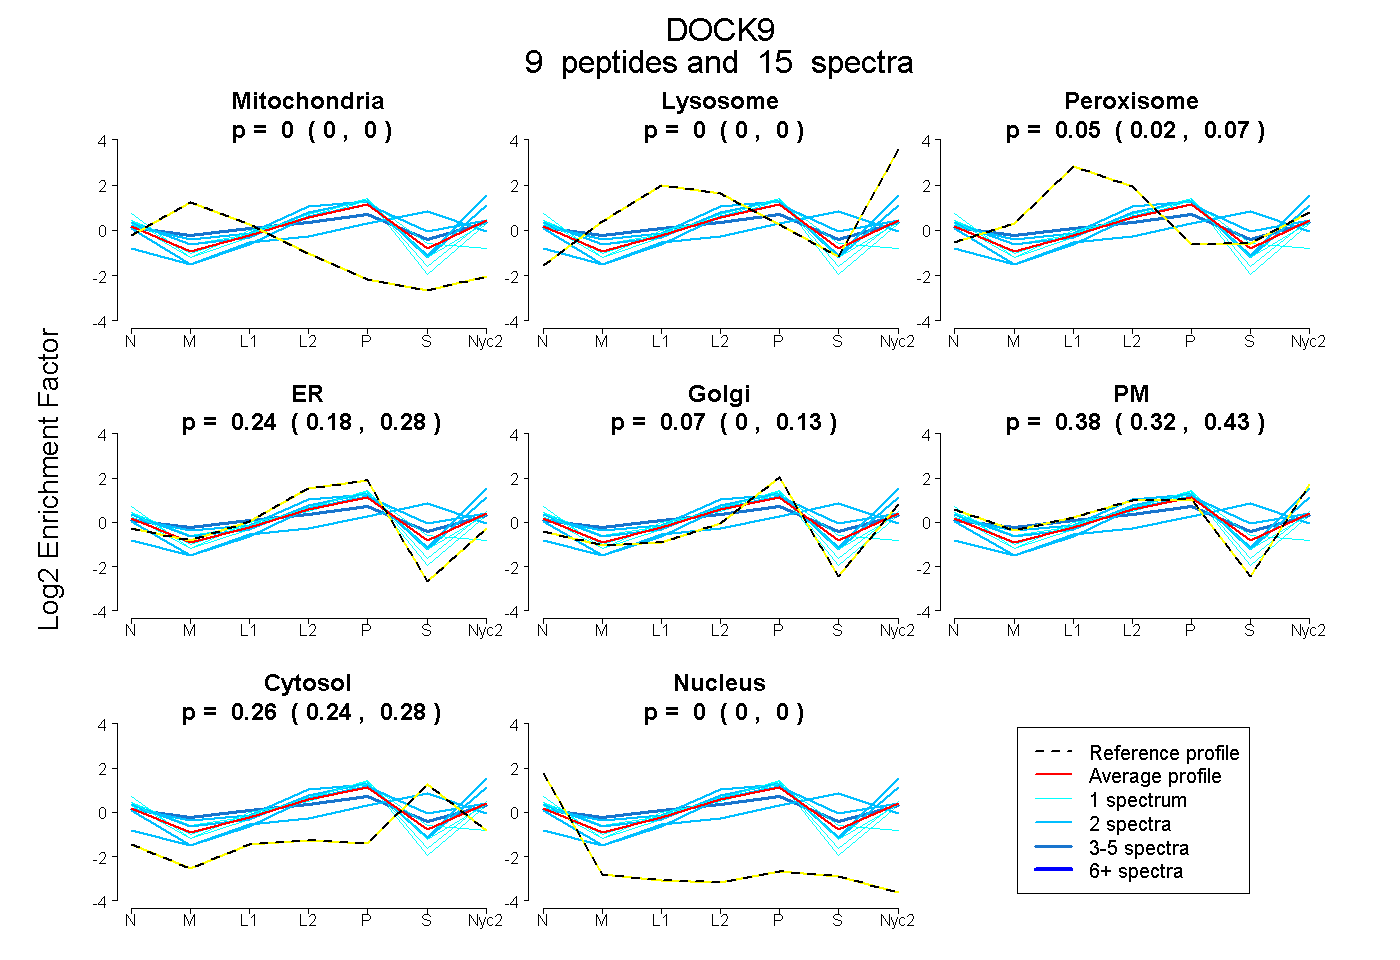
| Plot | Mito | Lyso | Perox | ER | Golgi | PM | Cytosol | Nucleus | |||||
| Expt A |
9 peptides |
15 spectra |
|
0.000 0.000 | 0.000 |
0.000 0.000 | 0.000 |
0.046 0.016 | 0.074 |
0.238 0.176 | 0.285 |
0.072 0.000 | 0.132 |
0.384 0.321 | 0.434 |
0.260 0.238 | 0.277 |
0.000 0.000 | 0.000 |
| 1 spectrum, ATQEEVAVNVTR | 0.000 | 0.000 | 0.000 | 0.375 | 0.074 | 0.417 | 0.063 | 0.071 | ||
| 2 spectra, YELIADIYK | 0.000 | 0.000 | 0.000 | 0.240 | 0.035 | 0.342 | 0.383 | 0.000 | ||
| 1 spectrum, MPFAWAAR | 0.000 | 0.000 | 0.000 | 0.345 | 0.053 | 0.403 | 0.198 | 0.000 | ||
| 2 spectra, FSAIYR | 0.000 | 0.000 | 0.010 | 0.068 | 0.117 | 0.650 | 0.154 | 0.000 | ||
| 1 spectrum, EVGTALQEFR | 0.000 | 0.000 | 0.000 | 0.321 | 0.072 | 0.473 | 0.130 | 0.004 | ||
| 2 spectra, HSFDDR | 0.000 | 0.135 | 0.000 | 0.060 | 0.076 | 0.609 | 0.121 | 0.000 | ||
| 2 spectra, LAHLYDTLHR | 0.000 | 0.020 | 0.167 | 0.000 | 0.237 | 0.000 | 0.577 | 0.000 | ||
| 3 spectra, EQICPLEEK | 0.017 | 0.000 | 0.273 | 0.000 | 0.254 | 0.226 | 0.231 | 0.000 | ||
| 1 spectrum, TILTAIHCFPYVK | 0.000 | 0.000 | 0.074 | 0.613 | 0.000 | 0.000 | 0.300 | 0.012 |
| Plot | Mito | Lyso or Perox | ER | Golgi | PM | Cytosol | Nucleus | ||||||
| Expt B |
1 peptide |
1 spectrum |
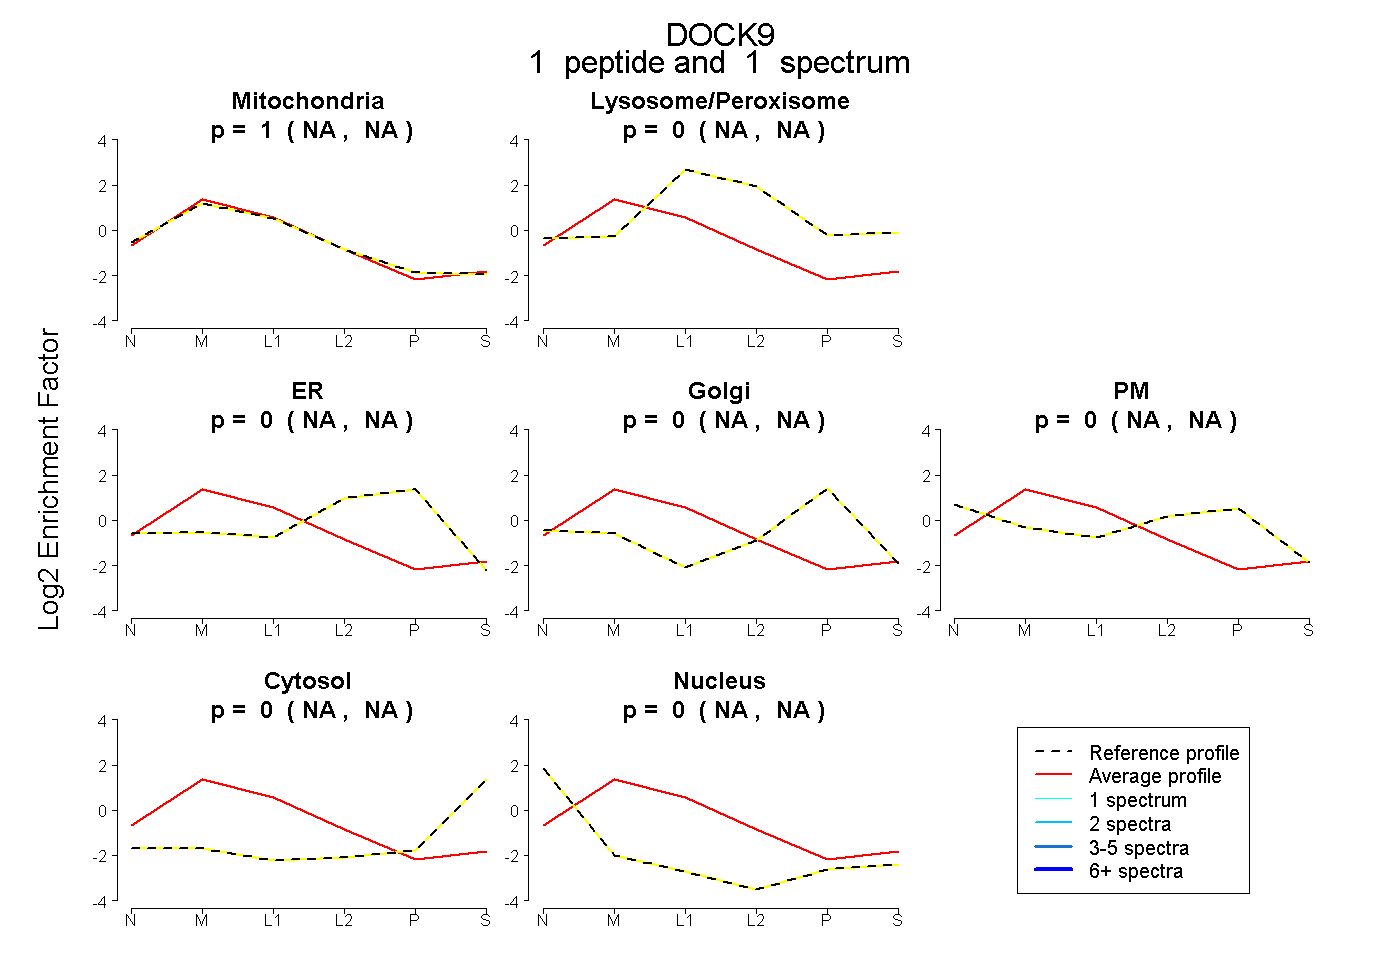 |
0.996 NA | NA |
0.000 NA | NA |
0.000 NA | NA |
0.000 NA | NA |
0.000 NA | NA |
0.004 NA | NA |
0.000 NA | NA |
|||
| Plot | Lyso | Other | |||||||||||
| Expt C |
7 peptides |
10 spectra |
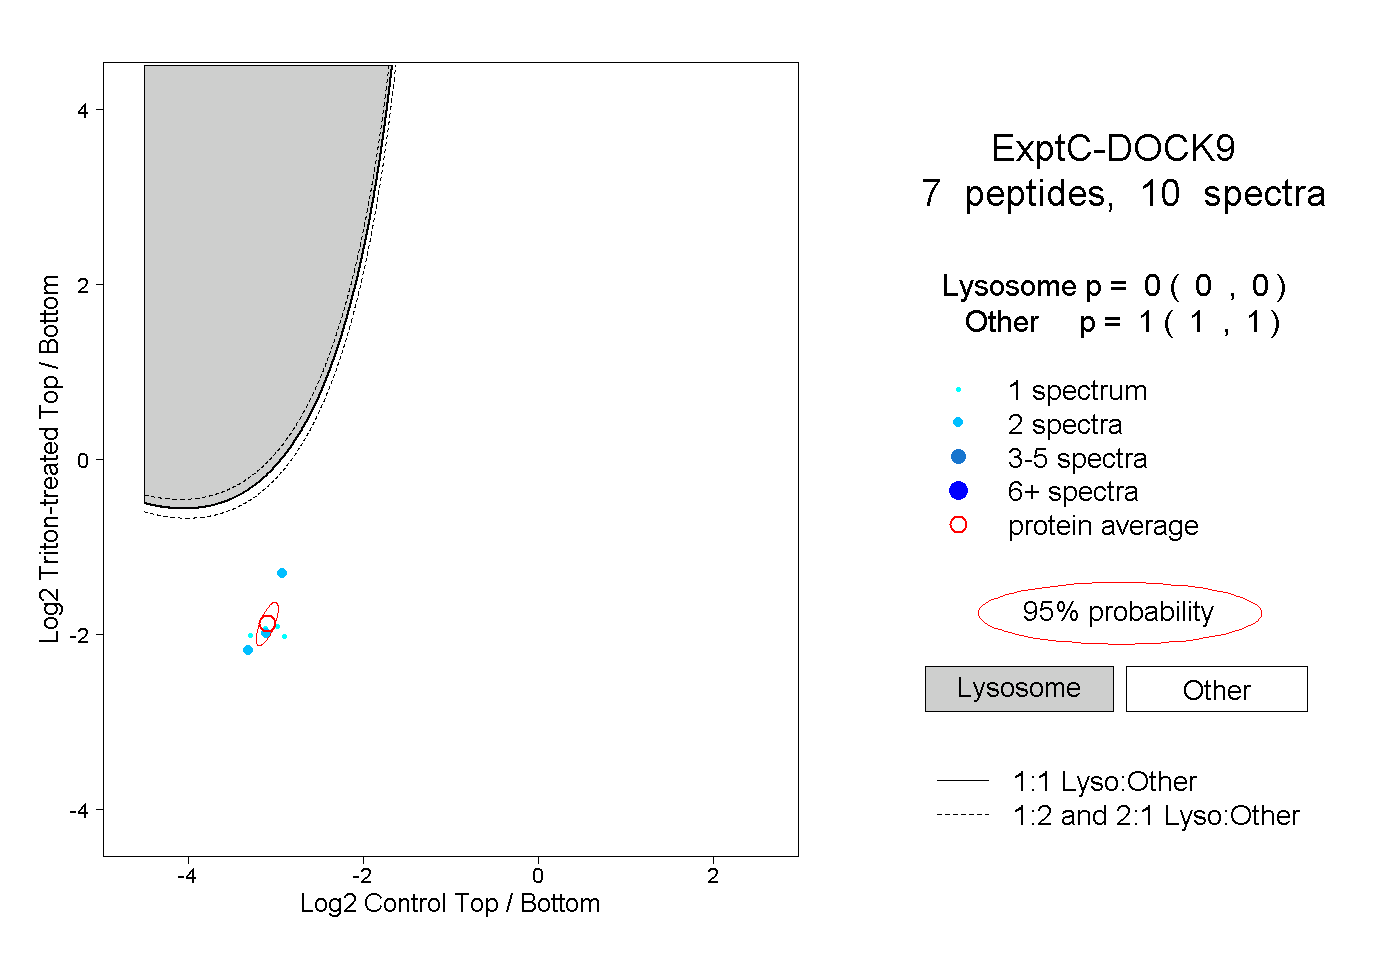 |
0.000 0.000 | 0.000 |
1.000 1.000 | 1.000 |