 15
15peptides
spectra
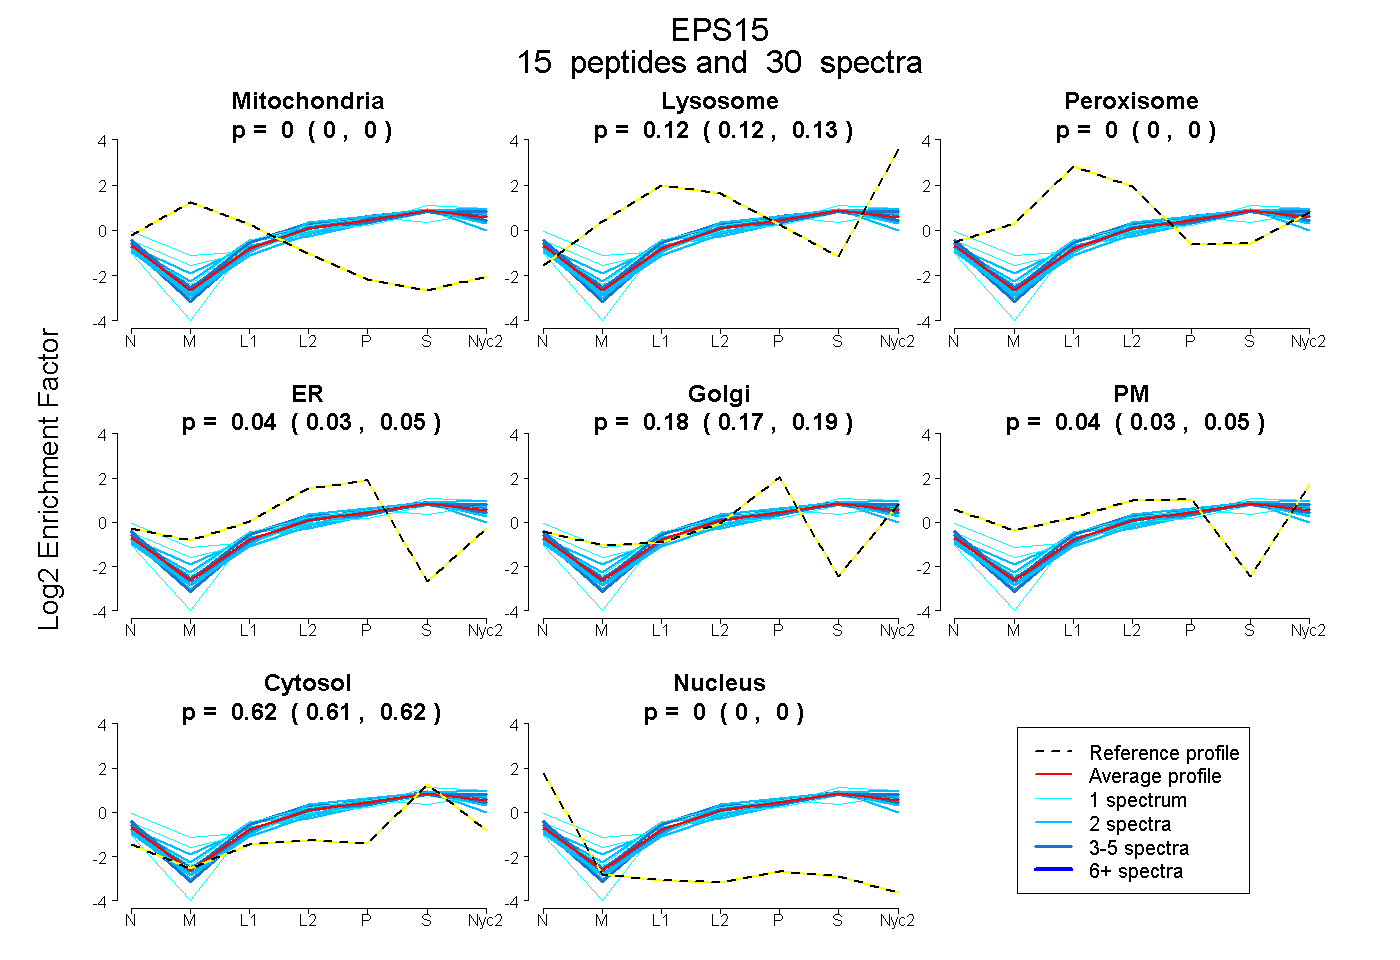
0.000 | 0.000
0.118 | 0.130
0.000 | 0.000
0.028 | 0.048
0.166 | 0.187
0.029 | 0.054
0.613 | 0.619
0.000 | 0.000
4peptides
spectra
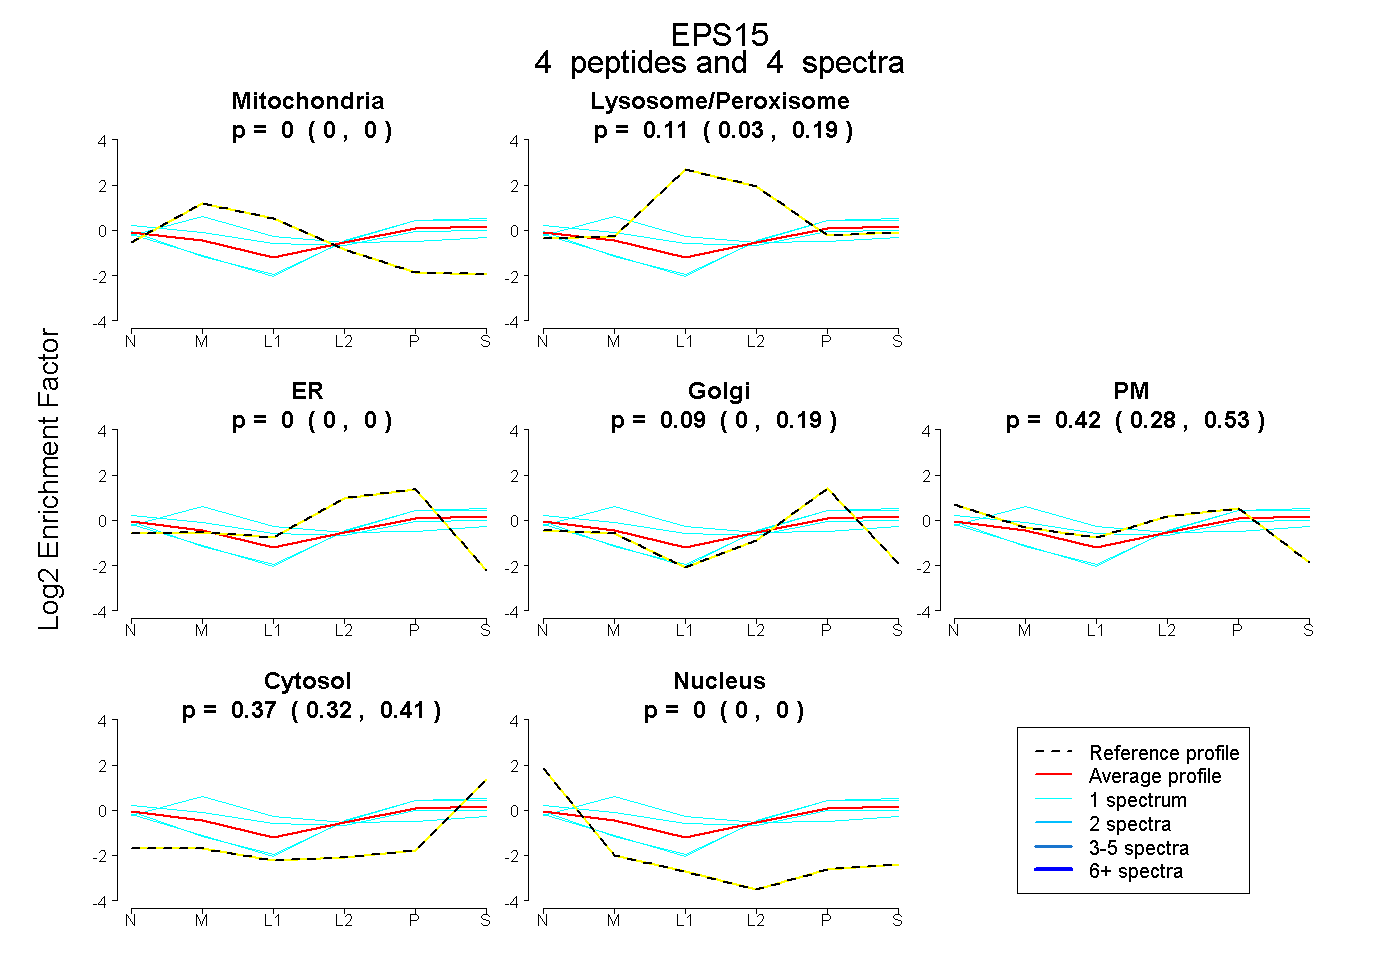
0.000 | 0.000
0.030 | 0.189
0.000 | 0.000
0.000 | 0.191
0.280 | 0.530
0.319 | 0.412
0.000 | 0.000
10peptides
spectra
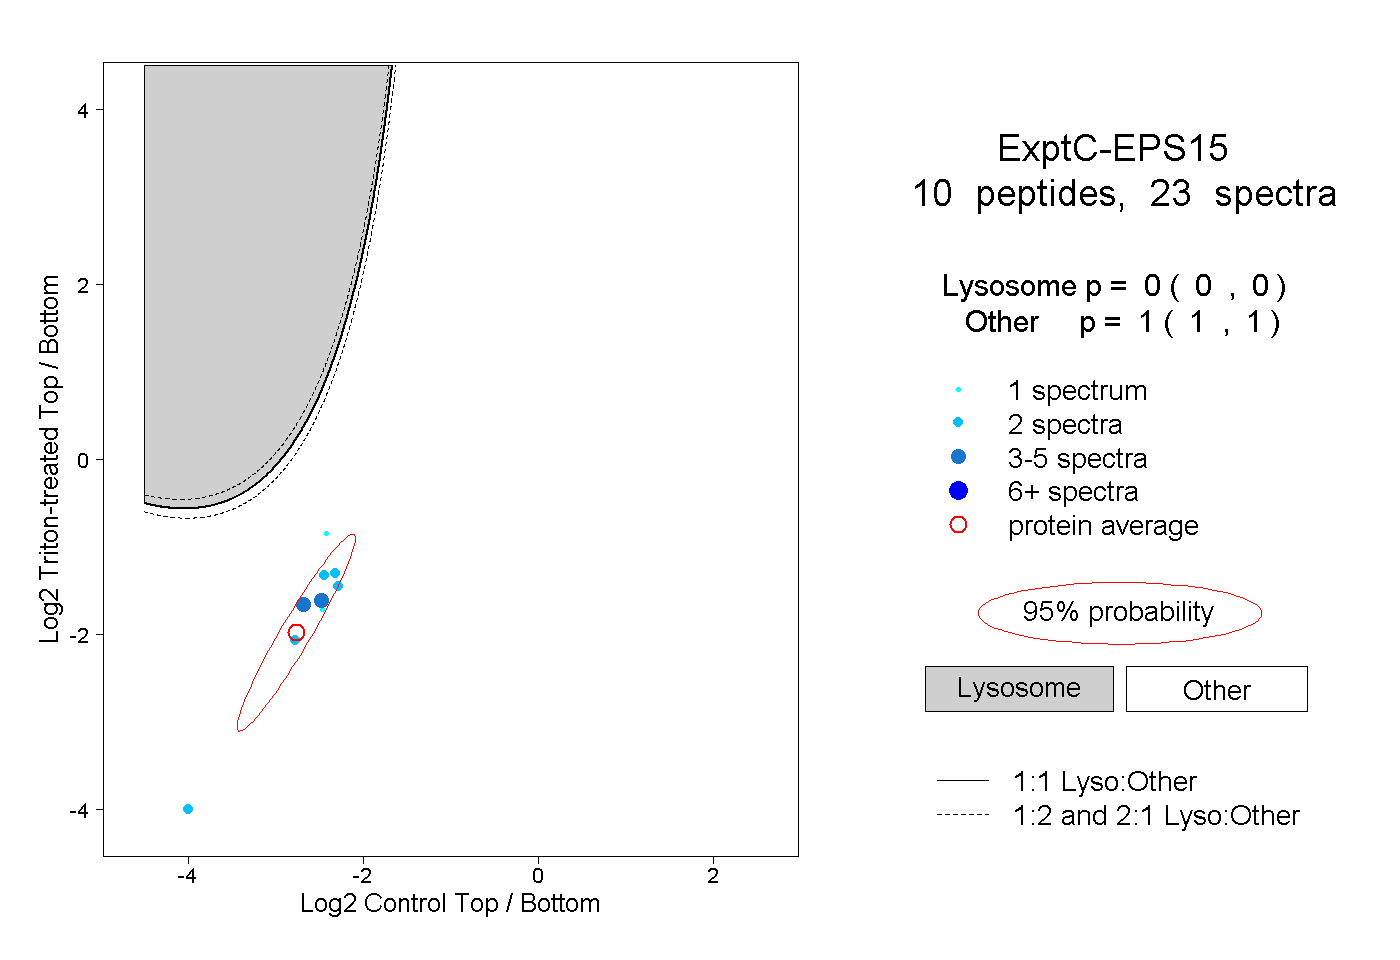
0.000 | 0.000
1.000 | 1.000
1peptide
spectra
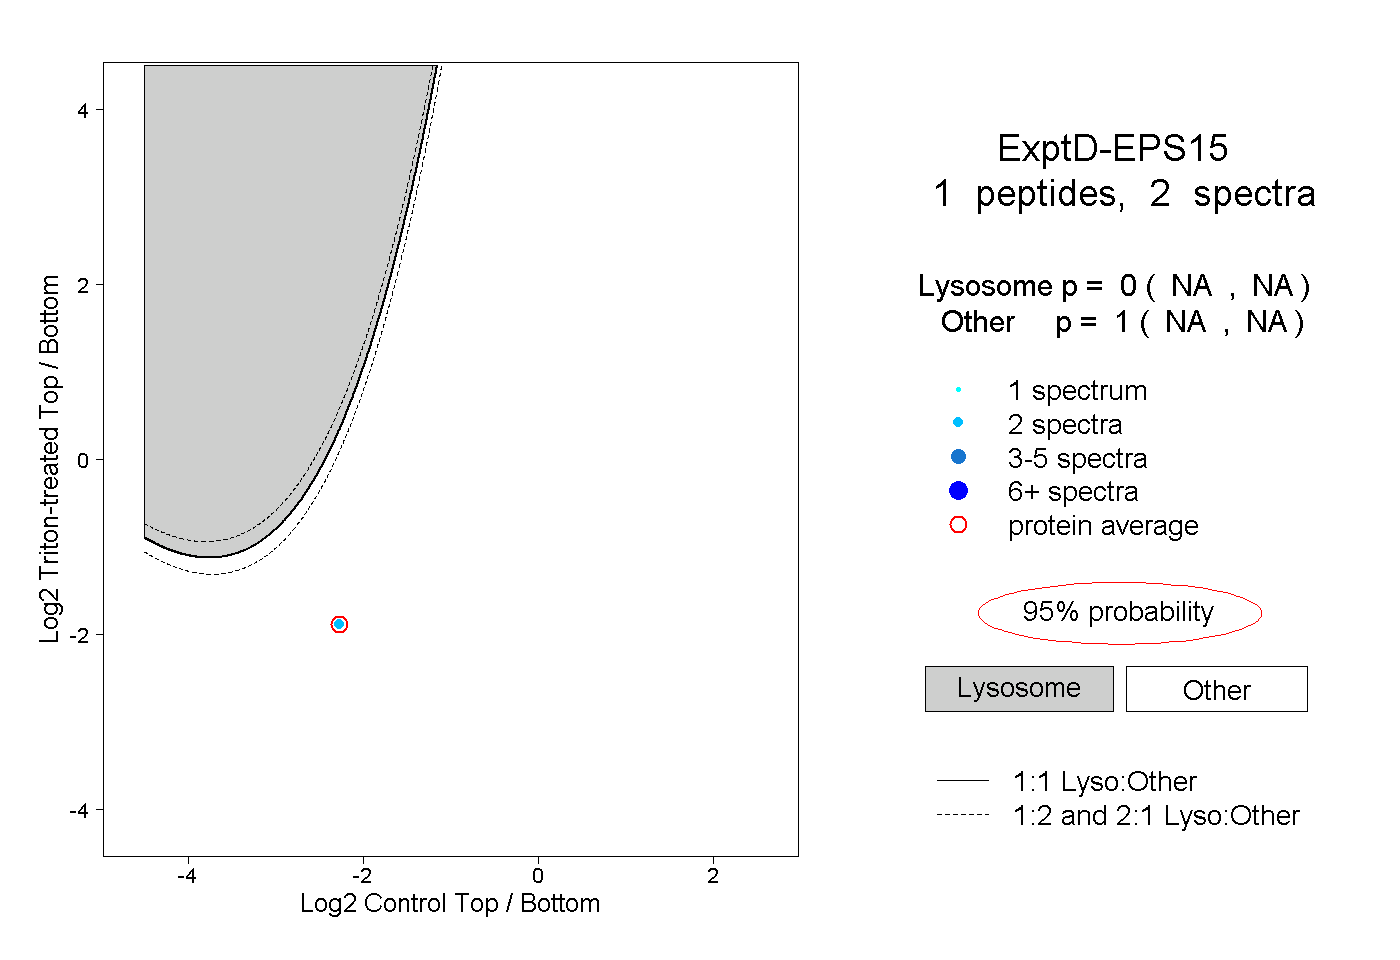
NA | NA
NA | NA