 15
15peptides
spectra
0.000 | 0.000
0.118 | 0.130
0.000 | 0.000
0.028 | 0.048
0.166 | 0.187
0.029 | 0.054
0.613 | 0.619
0.000 | 0.000
| Plot | Mito | Lyso | Perox | ER | Golgi | PM | Cytosol | Nucleus | |||||
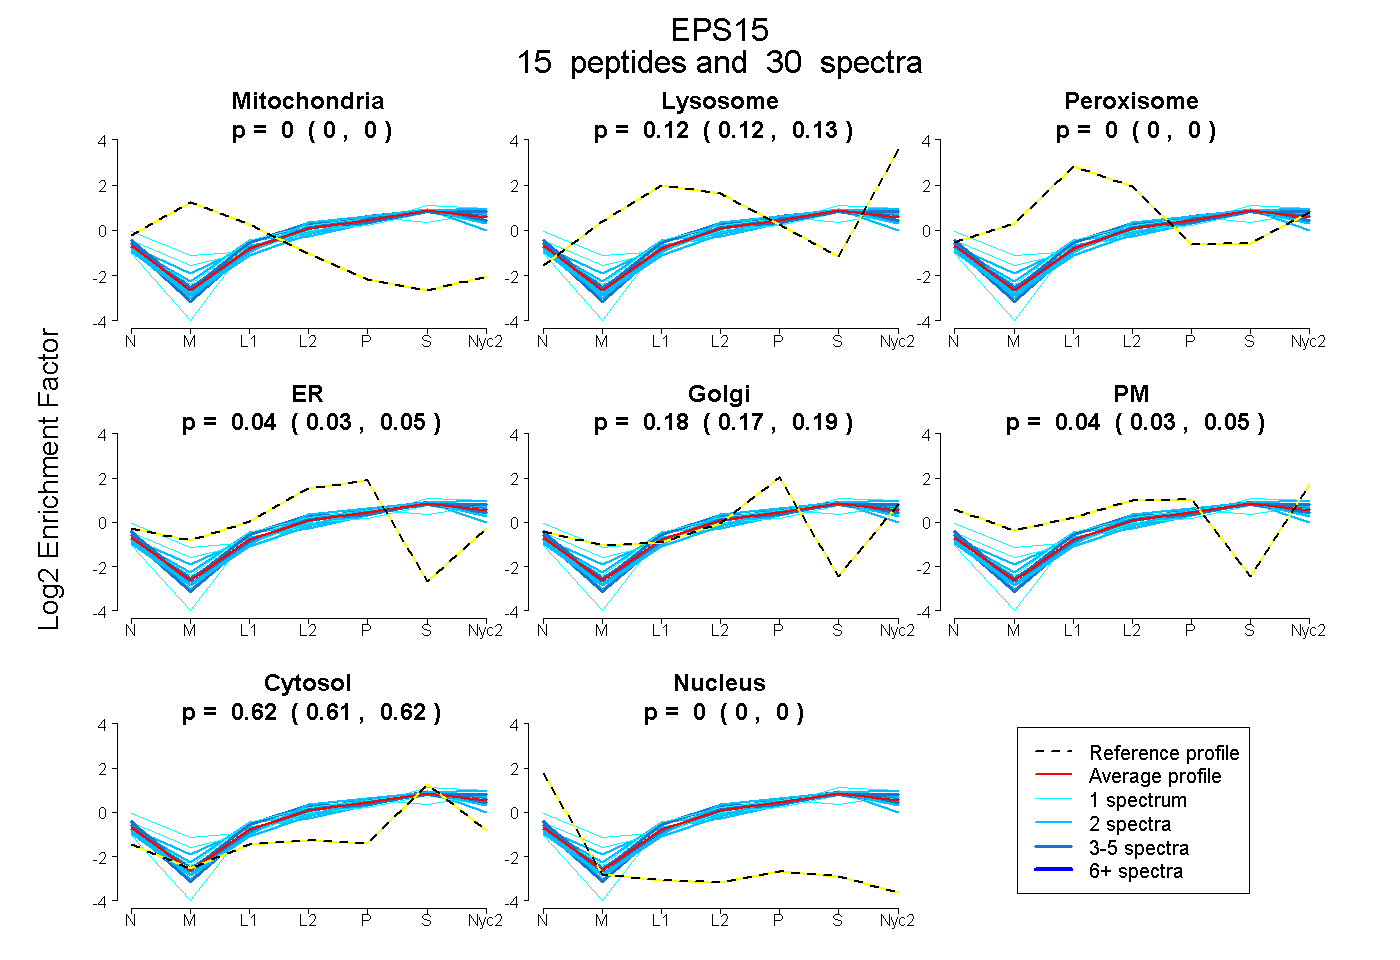
| Expt A |
15 peptides |
30 spectra |
|
0.000 0.000 | 0.000 |
0.124 0.118 | 0.130 |
0.000 0.000 | 0.000 |
0.039 0.028 | 0.048 |
0.178 0.166 | 0.187 |
0.043 0.029 | 0.054 |
0.616 0.613 | 0.619 |
0.000 0.000 | 0.000 |
| 2 spectra, IWDLADTDGK | 0.000 | 0.132 | 0.000 | 0.046 | 0.182 | 0.014 | 0.625 | 0.000 | ||
| 2 spectra, ELDTLNNEIIDLQR | 0.000 | 0.121 | 0.038 | 0.000 | 0.201 | 0.029 | 0.611 | 0.000 | ||
| 2 spectra, VWELSDIDHDGK | 0.000 | 0.172 | 0.000 | 0.000 | 0.252 | 0.000 | 0.576 | 0.000 | ||
| 3 spectra, QVEAGNTGR | 0.000 | 0.128 | 0.000 | 0.025 | 0.011 | 0.237 | 0.599 | 0.000 | ||
| 2 spectra, AQLEEQLK | 0.000 | 0.201 | 0.000 | 0.000 | 0.151 | 0.039 | 0.609 | 0.000 | ||
| 2 spectra, YDEIFLK | 0.000 | 0.057 | 0.000 | 0.001 | 0.295 | 0.000 | 0.648 | 0.000 | ||
| 1 spectrum, QEFFIALR | 0.000 | 0.063 | 0.000 | 0.035 | 0.011 | 0.278 | 0.613 | 0.000 | ||
| 3 spectra, VLALDAAAFLK | 0.000 | 0.043 | 0.000 | 0.052 | 0.100 | 0.177 | 0.629 | 0.000 | ||
| 4 spectra, LPVEILGR | 0.000 | 0.110 | 0.000 | 0.020 | 0.244 | 0.000 | 0.626 | 0.000 | ||
| 1 spectrum, VKPVLLNSK | 0.000 | 0.192 | 0.000 | 0.124 | 0.103 | 0.000 | 0.581 | 0.000 | ||
| 3 spectra, TTEAQDLQDEVQR | 0.000 | 0.089 | 0.000 | 0.061 | 0.098 | 0.118 | 0.633 | 0.000 | ||
| 1 spectrum, CAEEAQLISSLK | 0.000 | 0.043 | 0.000 | 0.000 | 0.037 | 0.449 | 0.471 | 0.000 | ||
| 1 spectrum, AQLEPLQQHLQDSQQEISSMQMR | 0.000 | 0.171 | 0.000 | 0.000 | 0.134 | 0.000 | 0.696 | 0.000 | ||
| 1 spectrum, IDPFGGDPFK | 0.000 | 0.078 | 0.000 | 0.000 | 0.277 | 0.000 | 0.645 | 0.000 | ||
| 2 spectra, GSDPFASDCFFK | 0.000 | 0.072 | 0.000 | 0.172 | 0.091 | 0.000 | 0.665 | 0.000 |
| Plot | Mito | Lyso or Perox | ER | Golgi | PM | Cytosol | Nucleus | ||||||
| Expt B |
4 peptides |
4 spectra |
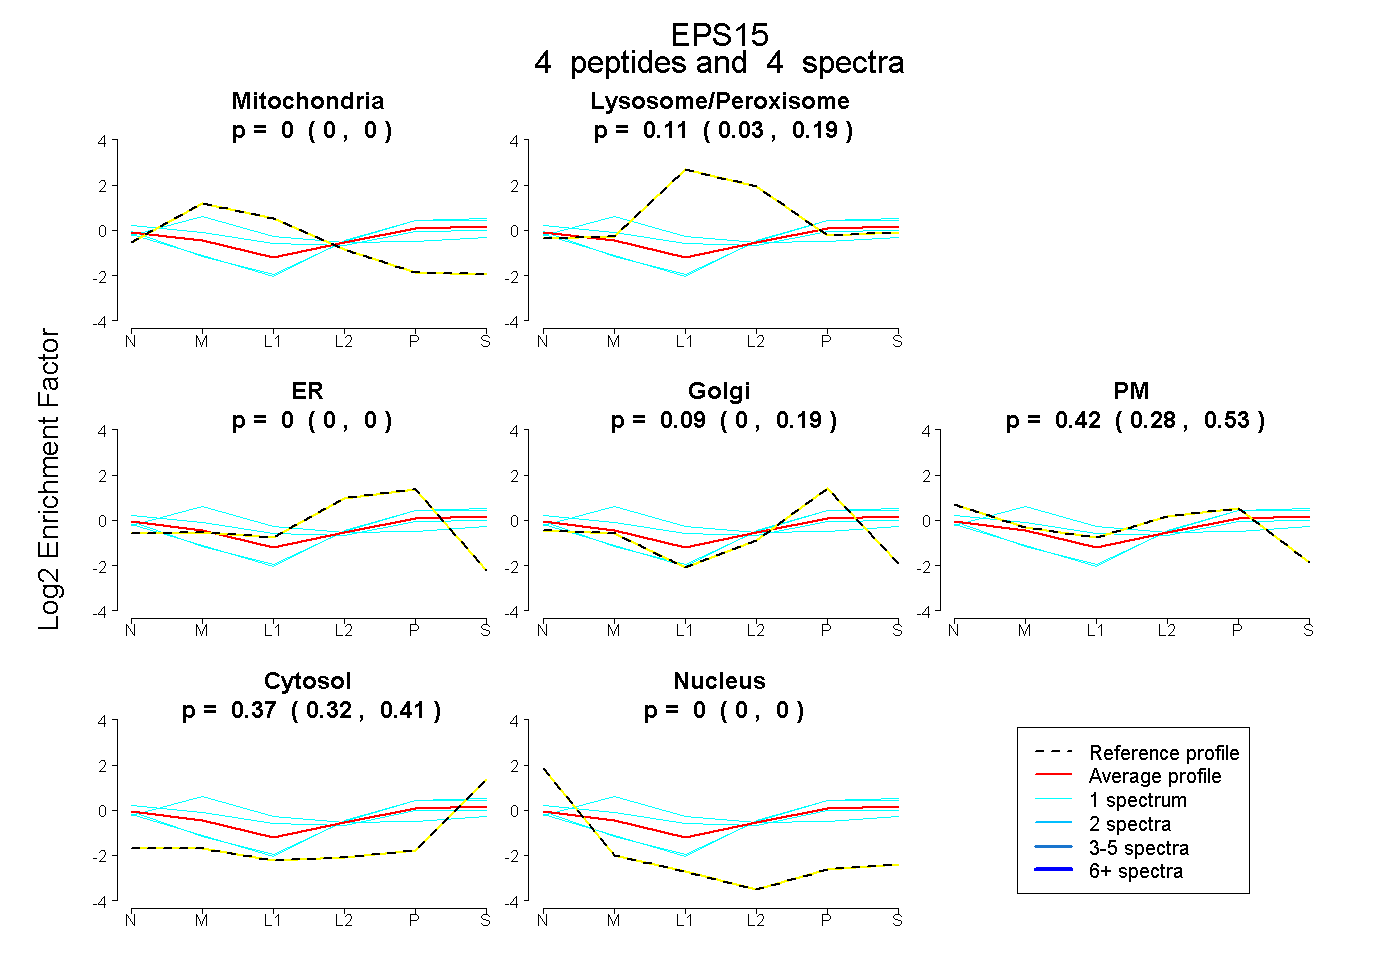 |
0.000 0.000 | 0.000 |
0.112 0.030 | 0.189 |
0.000 0.000 | 0.000 |
0.094 0.000 | 0.191 |
0.424 0.280 | 0.530 |
0.370 0.319 | 0.412 |
0.000 0.000 | 0.000 |
|||
| Plot | Lyso | Other | |||||||||||
| Expt C |
10 peptides |
23 spectra |
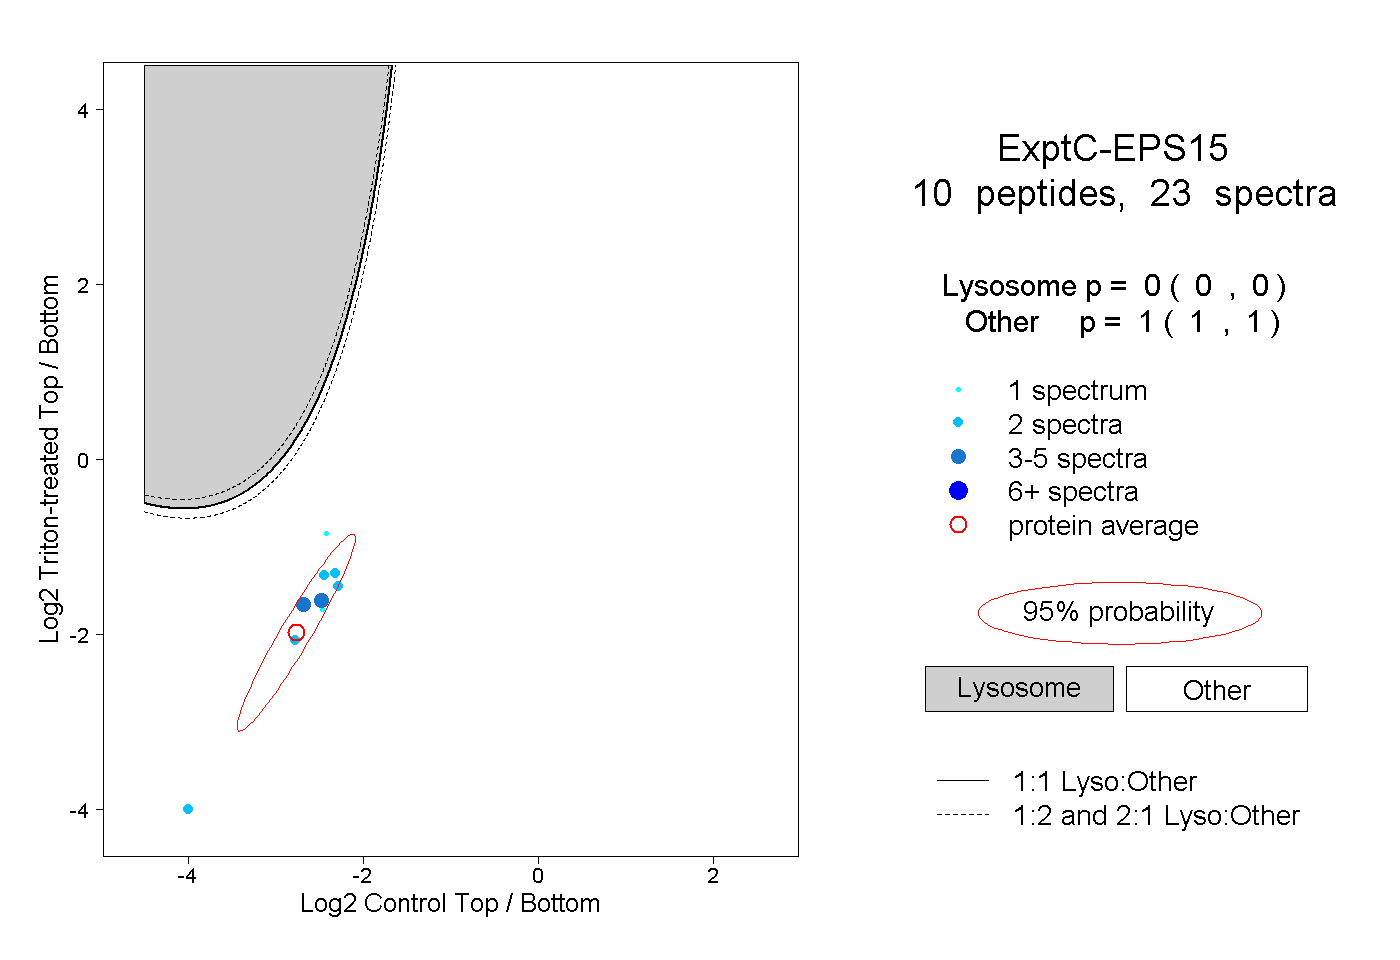 |
0.000 0.000 | 0.000 |
1.000 1.000 | 1.000 |
||||||||
| Plot | Lyso | Other | |||||||||||
| Expt D |
1 peptide |
2 spectra |
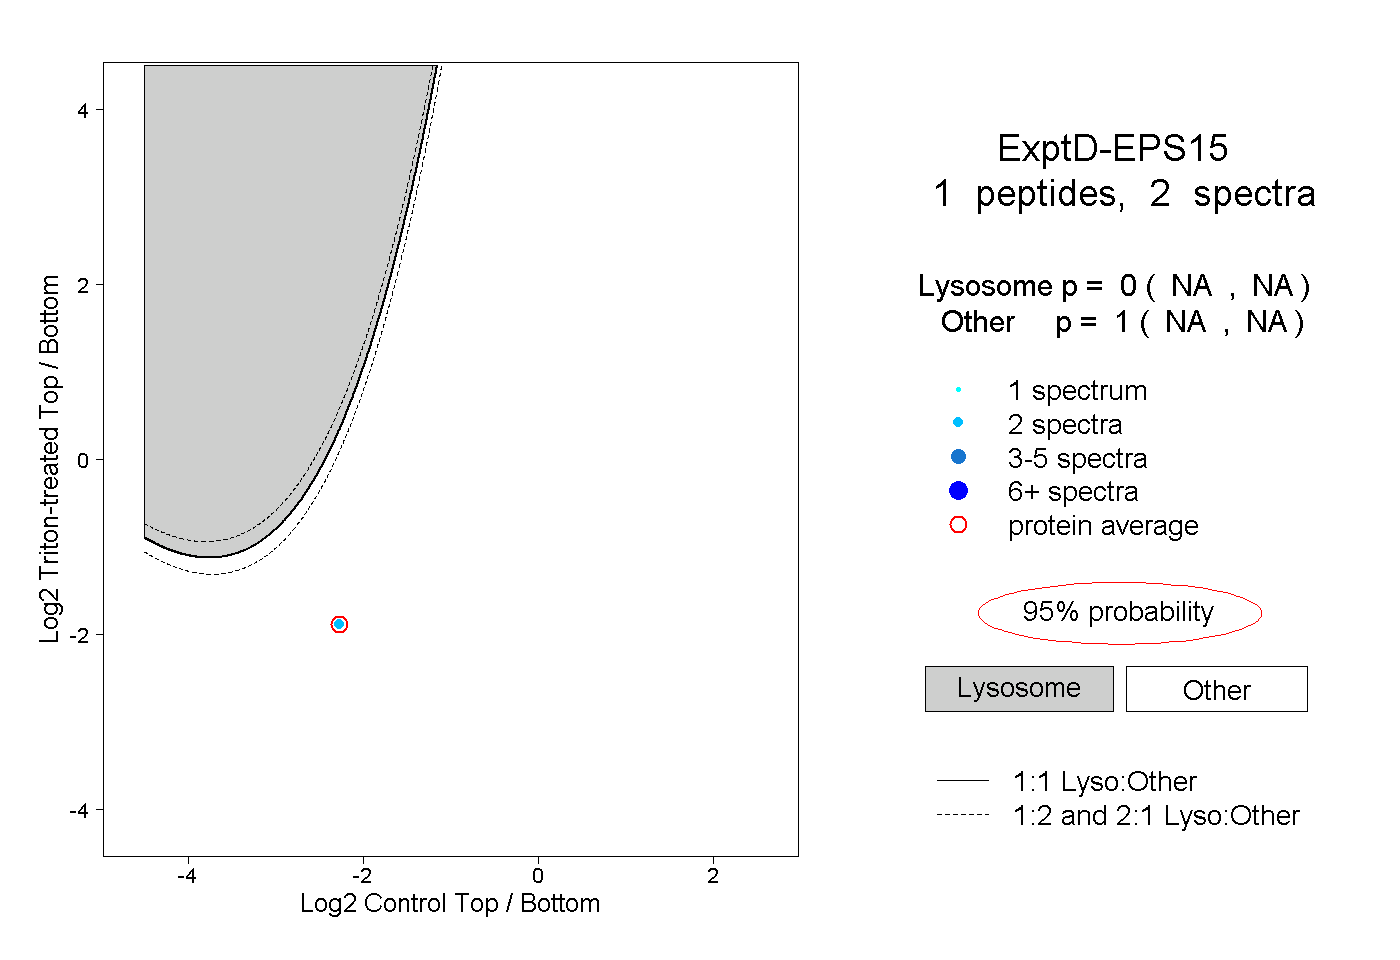 |
0.000 NA | NA |
1.000 NA | NA |