 7
7peptides
spectra
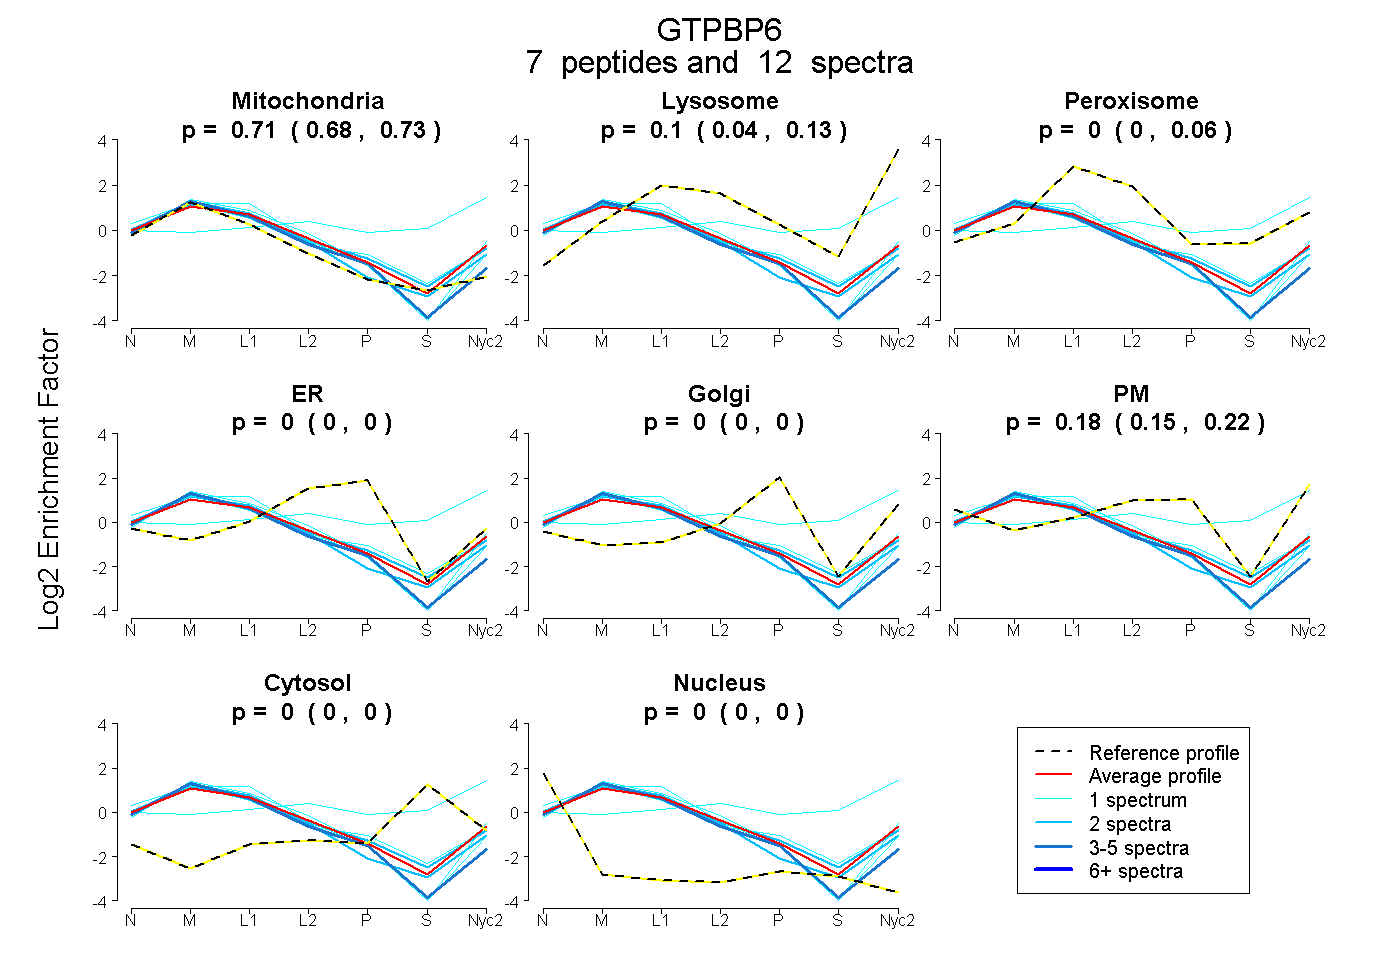
0.682 | 0.727
0.045 | 0.129
0.000 | 0.059
0.000 | 0.000
0.000 | 0.000
0.147 | 0.219
0.000 | 0.000
0.000 | 0.000
1peptide
spectra
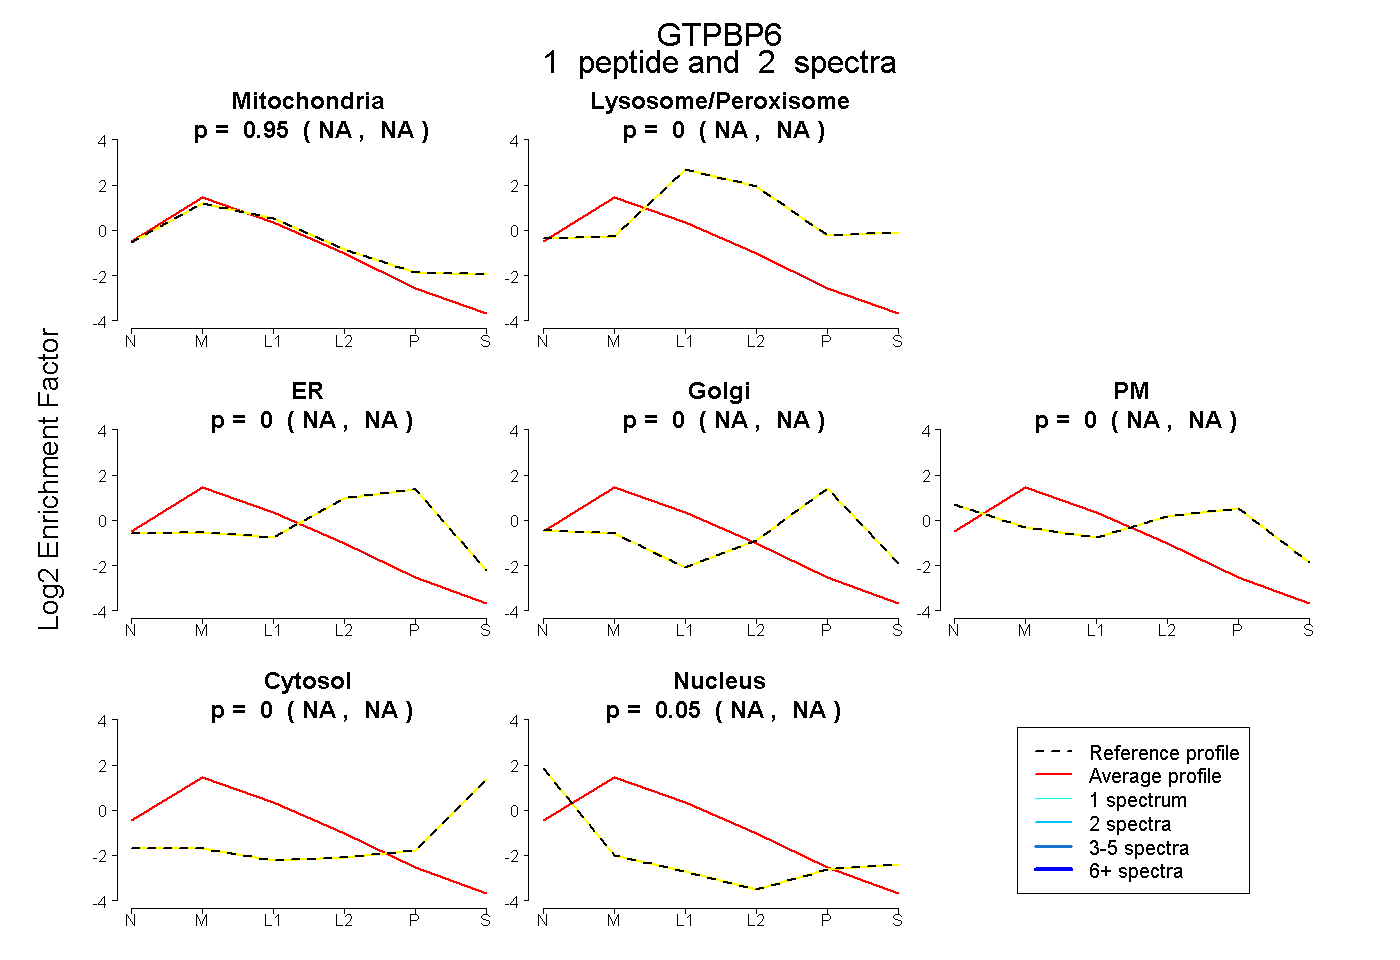
NA | NA
NA | NA
NA | NA
NA | NA
NA | NA
NA | NA
NA | NA
7peptides
spectra
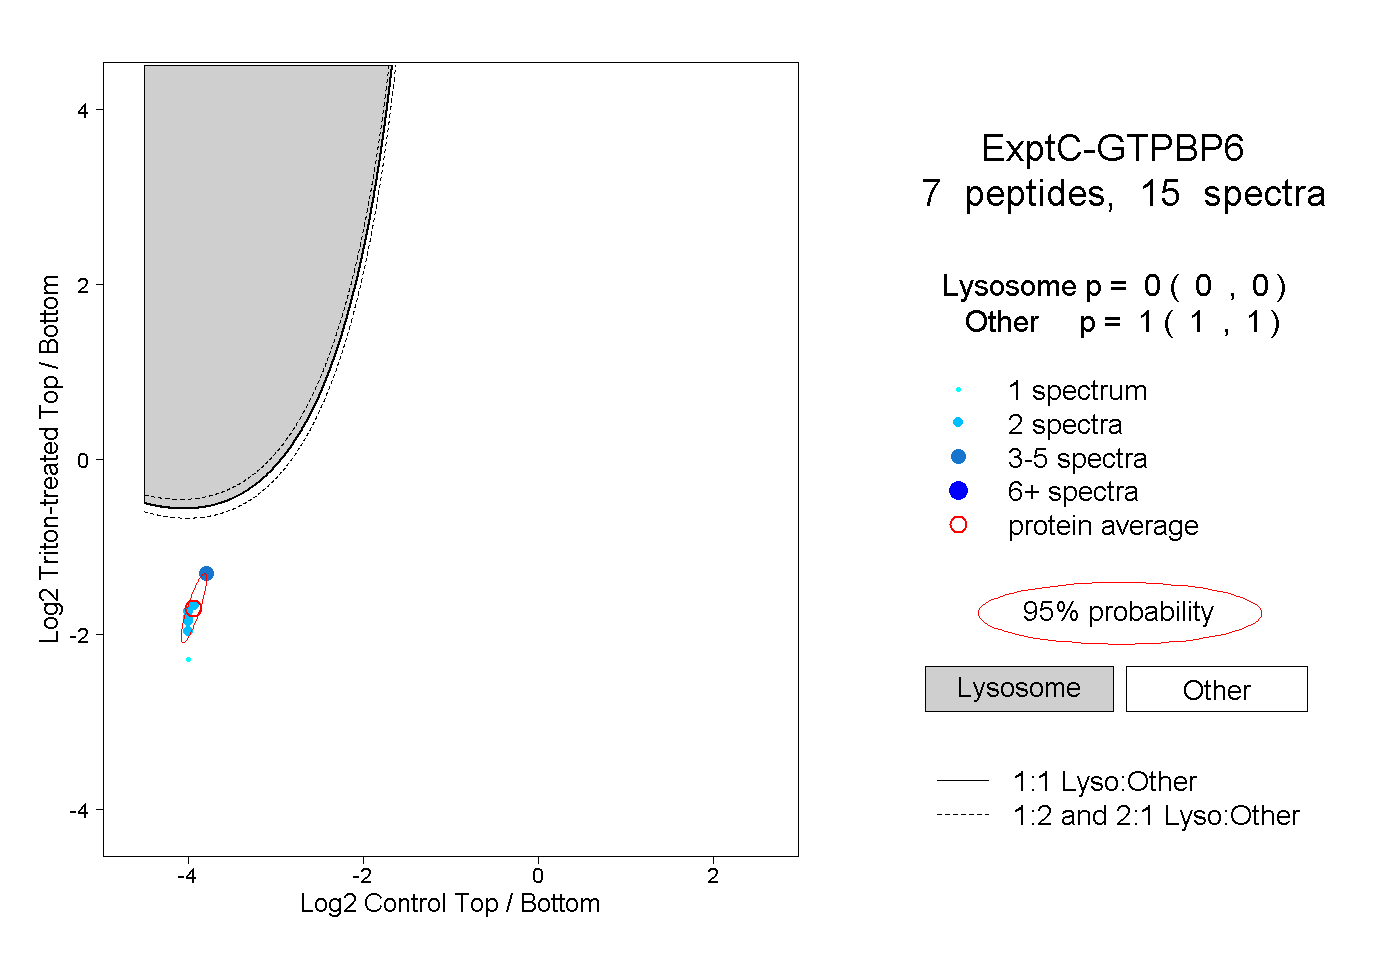
0.000 | 0.000
1.000 | 1.000
2peptides
spectra
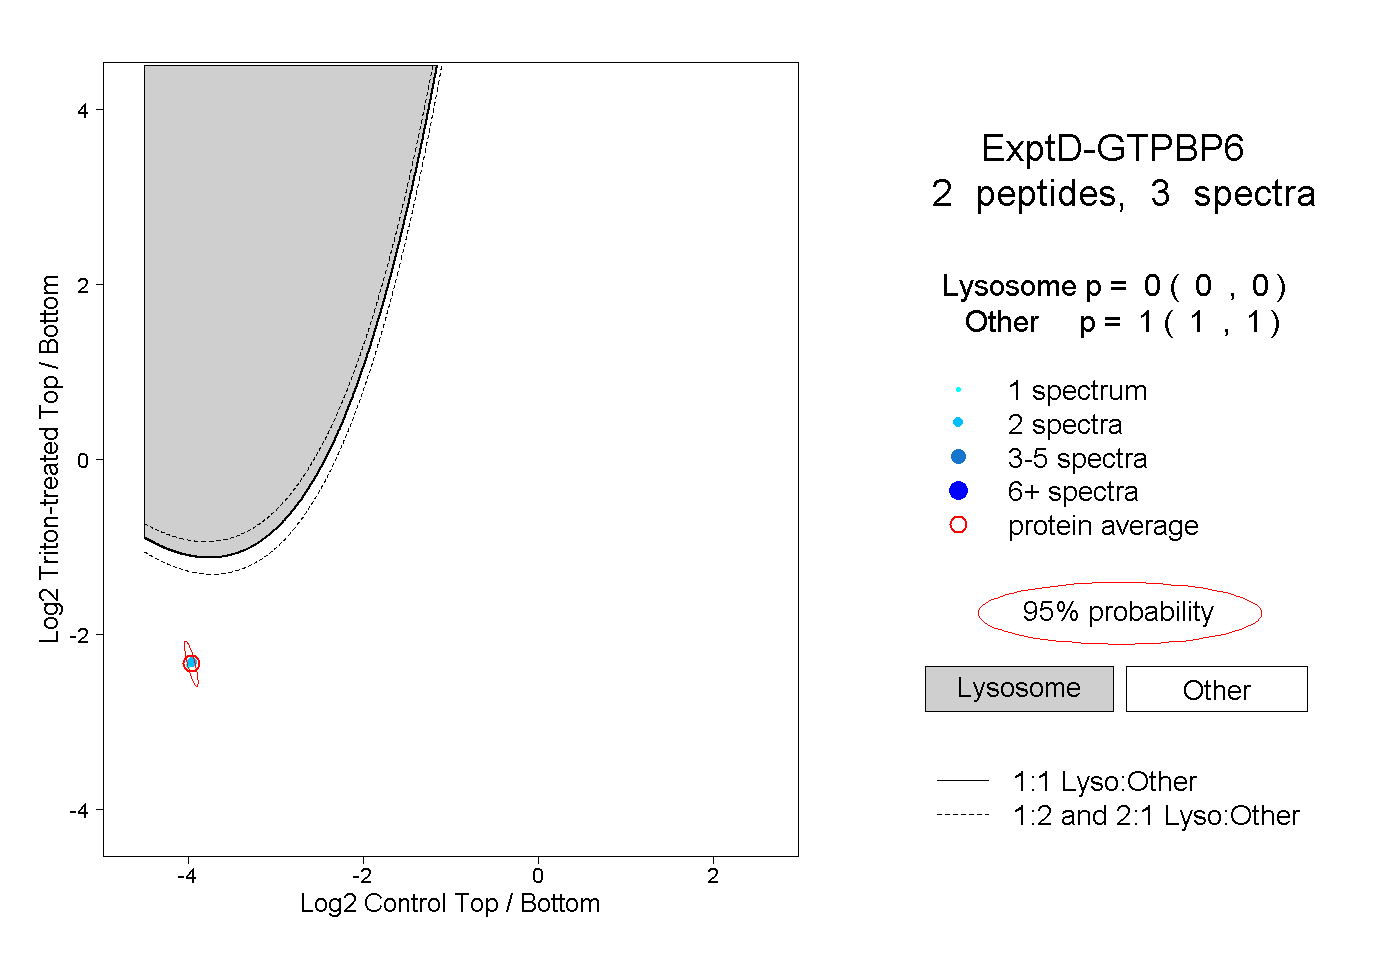
0.000 | 0.000
1.000 | 1.000