 7
7peptides
spectra
0.682 | 0.727
0.045 | 0.129
0.000 | 0.059
0.000 | 0.000
0.000 | 0.000
0.147 | 0.219
0.000 | 0.000
0.000 | 0.000
| Plot | Mito | Lyso | Perox | ER | Golgi | PM | Cytosol | Nucleus | |||||
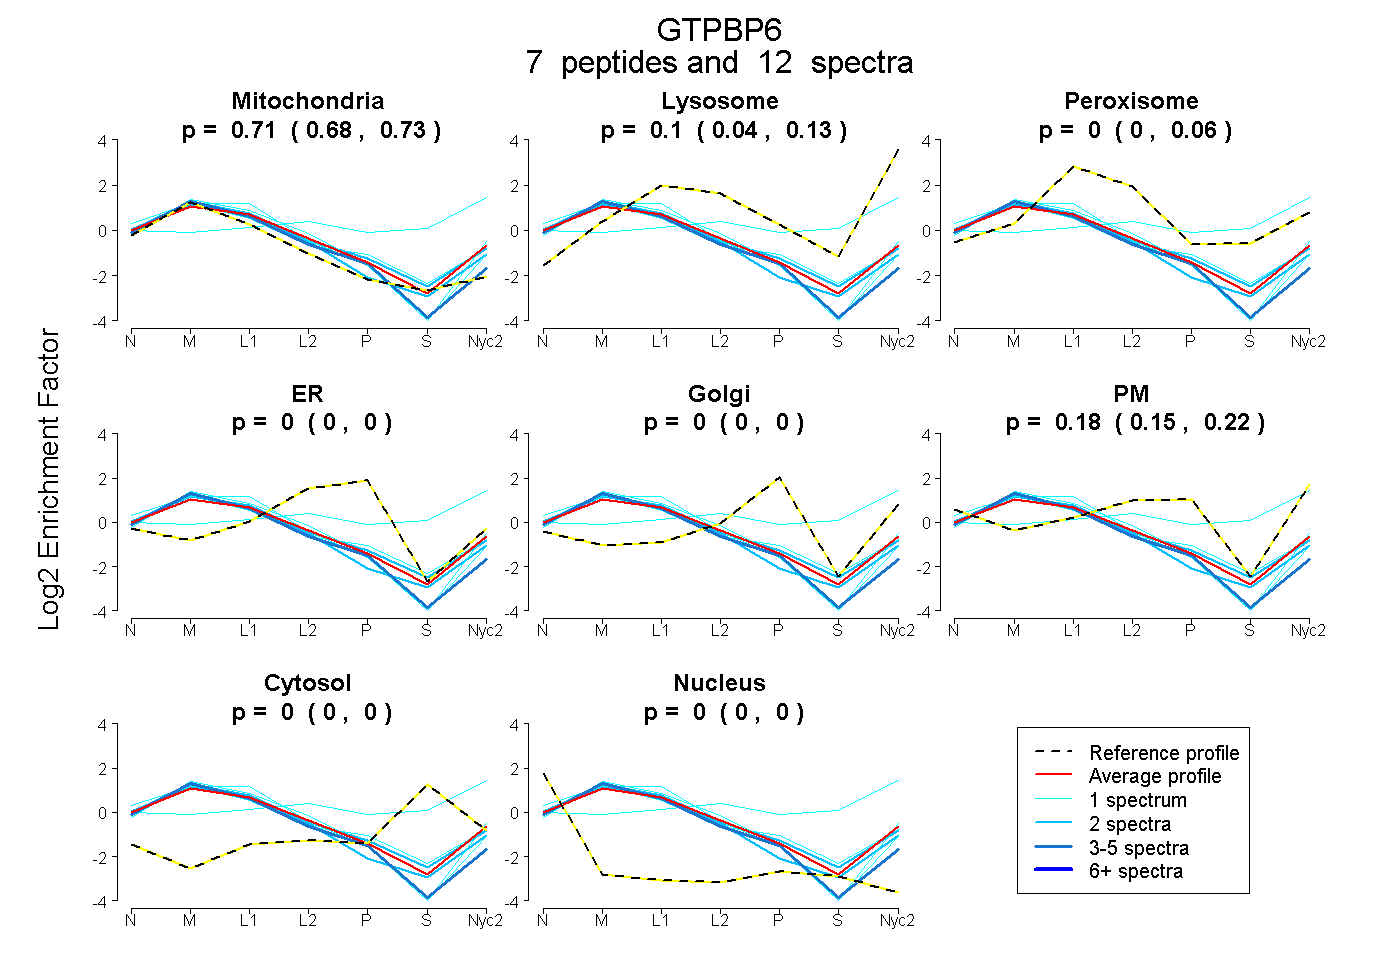
| Expt A |
7 peptides |
12 spectra |
|
0.711 0.682 | 0.727 |
0.103 0.045 | 0.129 |
0.002 0.000 | 0.059 |
0.000 0.000 | 0.000 |
0.000 0.000 | 0.000 |
0.185 0.147 | 0.219 |
0.000 0.000 | 0.000 |
0.000 0.000 | 0.000 |
| 1 spectrum, MQLALAEIPLLR | 0.779 | 0.039 | 0.000 | 0.034 | 0.000 | 0.147 | 0.000 | 0.000 | ||
| 1 spectrum, AALEASVLR | 0.717 | 0.112 | 0.000 | 0.000 | 0.034 | 0.137 | 0.000 | 0.000 | ||
| 1 spectrum, GLGLRPALLESAVEVHSK | 0.714 | 0.042 | 0.000 | 0.000 | 0.000 | 0.243 | 0.000 | 0.000 | ||
| 2 spectra, ALTGEATLQPR | 0.844 | 0.101 | 0.016 | 0.000 | 0.000 | 0.039 | 0.000 | 0.000 | ||
| 2 spectra, ALPGWSVAR | 0.702 | 0.053 | 0.071 | 0.000 | 0.000 | 0.174 | 0.000 | 0.000 | ||
| 1 spectrum, SSVSGDSEQQDQQGWGSR | 0.000 | 0.222 | 0.142 | 0.000 | 0.000 | 0.313 | 0.323 | 0.000 | ||
| 4 spectra, TLVVSSAAPGSR | 0.856 | 0.000 | 0.000 | 0.118 | 0.000 | 0.027 | 0.000 | 0.000 |
| Plot | Mito | Lyso or Perox | ER | Golgi | PM | Cytosol | Nucleus | ||||||
| Expt B |
1 peptide |
2 spectra |
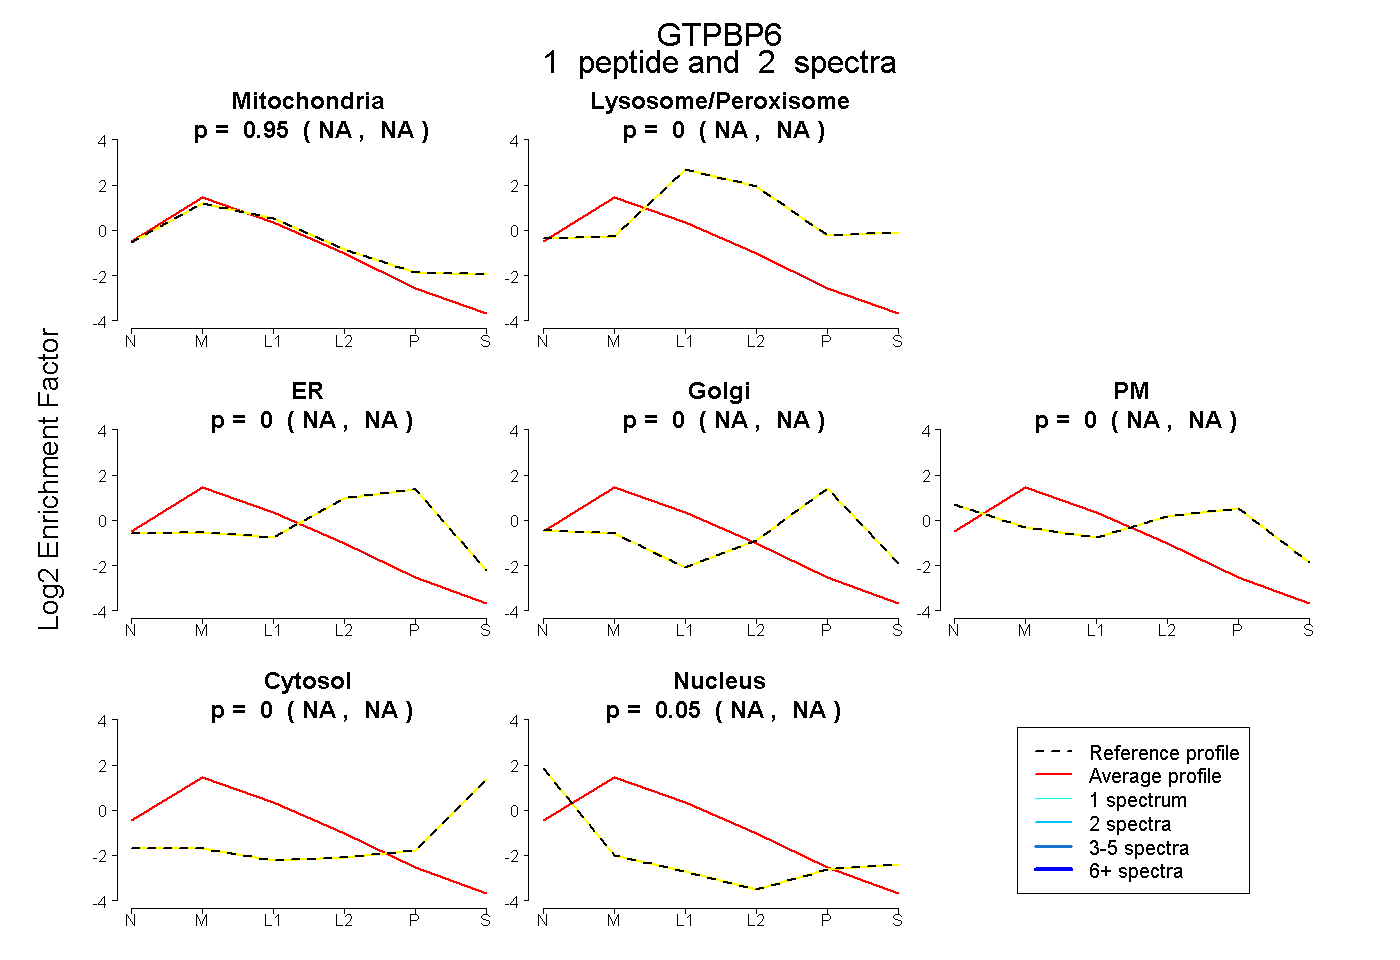 |
0.950 NA | NA |
0.000 NA | NA |
0.000 NA | NA |
0.000 NA | NA |
0.000 NA | NA |
0.000 NA | NA |
0.050 NA | NA |
|||
| Plot | Lyso | Other | |||||||||||
| Expt C |
7 peptides |
15 spectra |
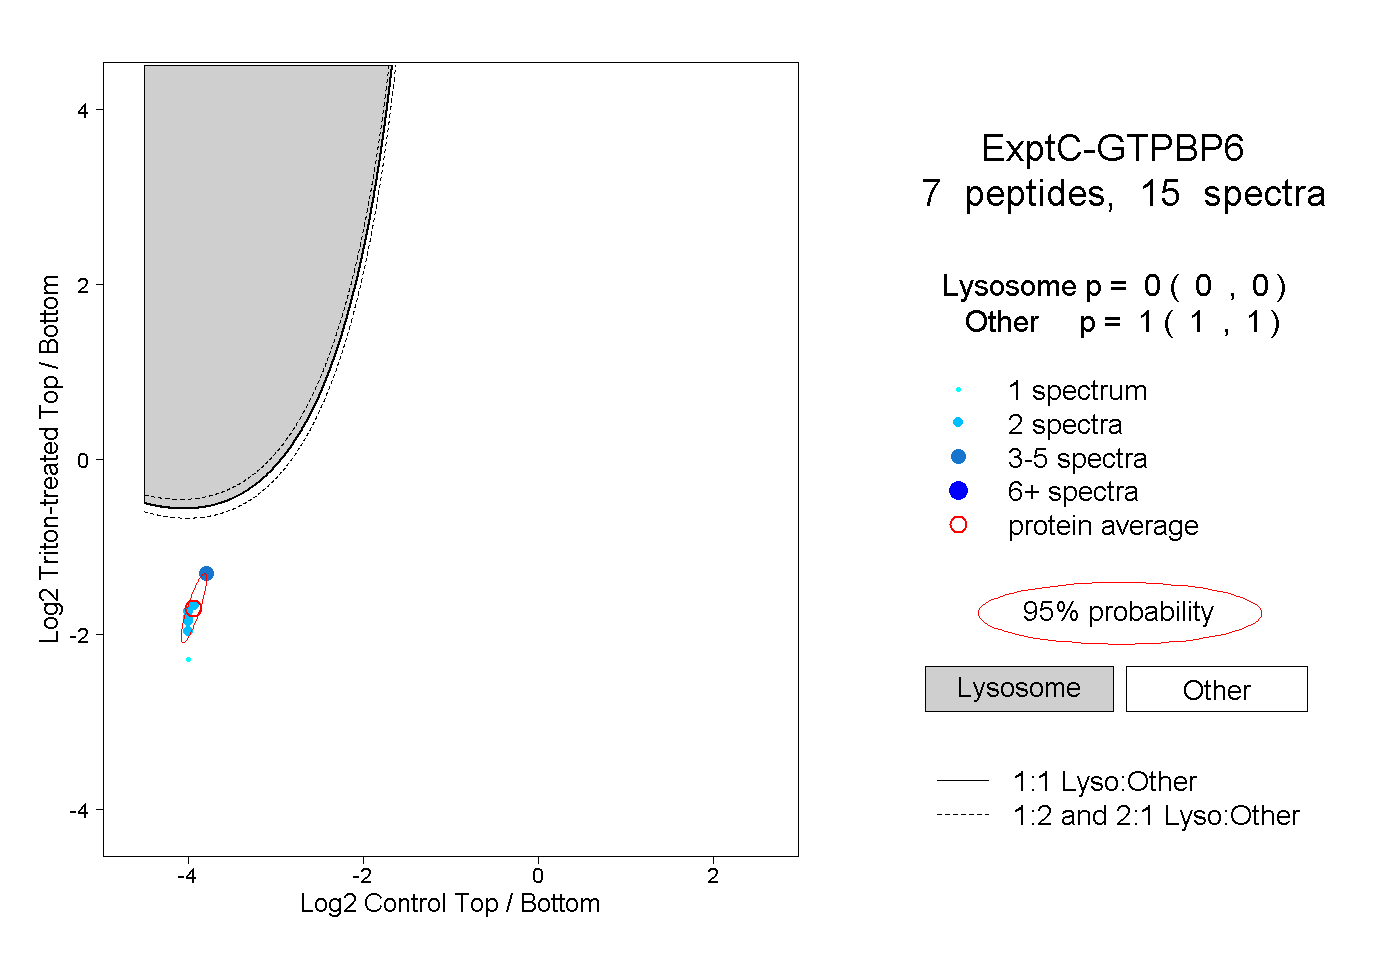 |
0.000 0.000 | 0.000 |
1.000 1.000 | 1.000 |
||||||||
| Plot | Lyso | Other | |||||||||||
| Expt D |
2 peptides |
3 spectra |
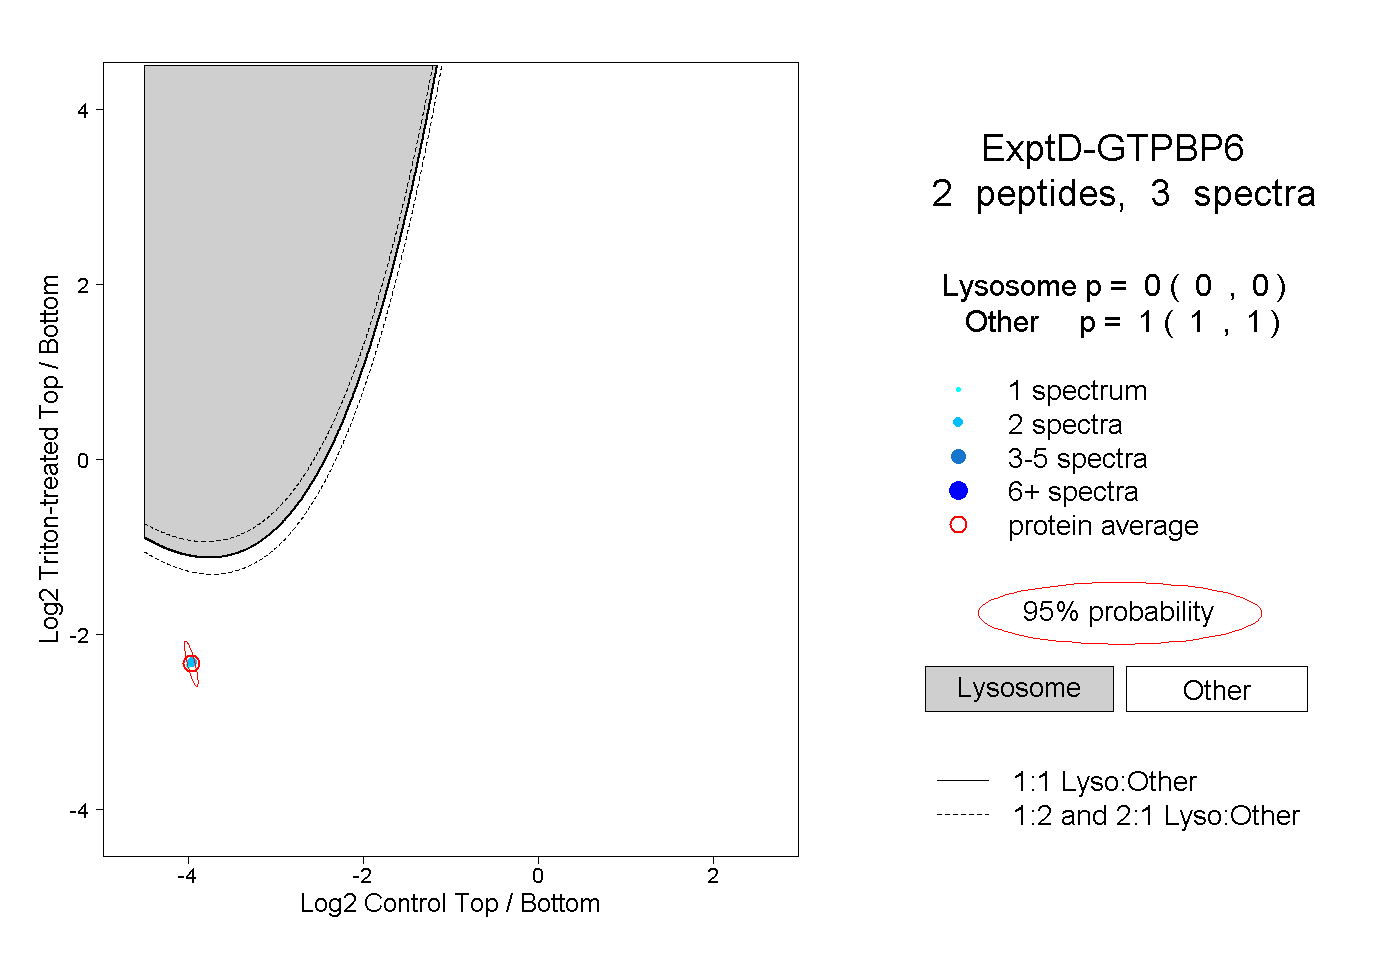 |
0.000 0.000 | 0.000 |
1.000 1.000 | 1.000 |