 20
20peptides
spectra
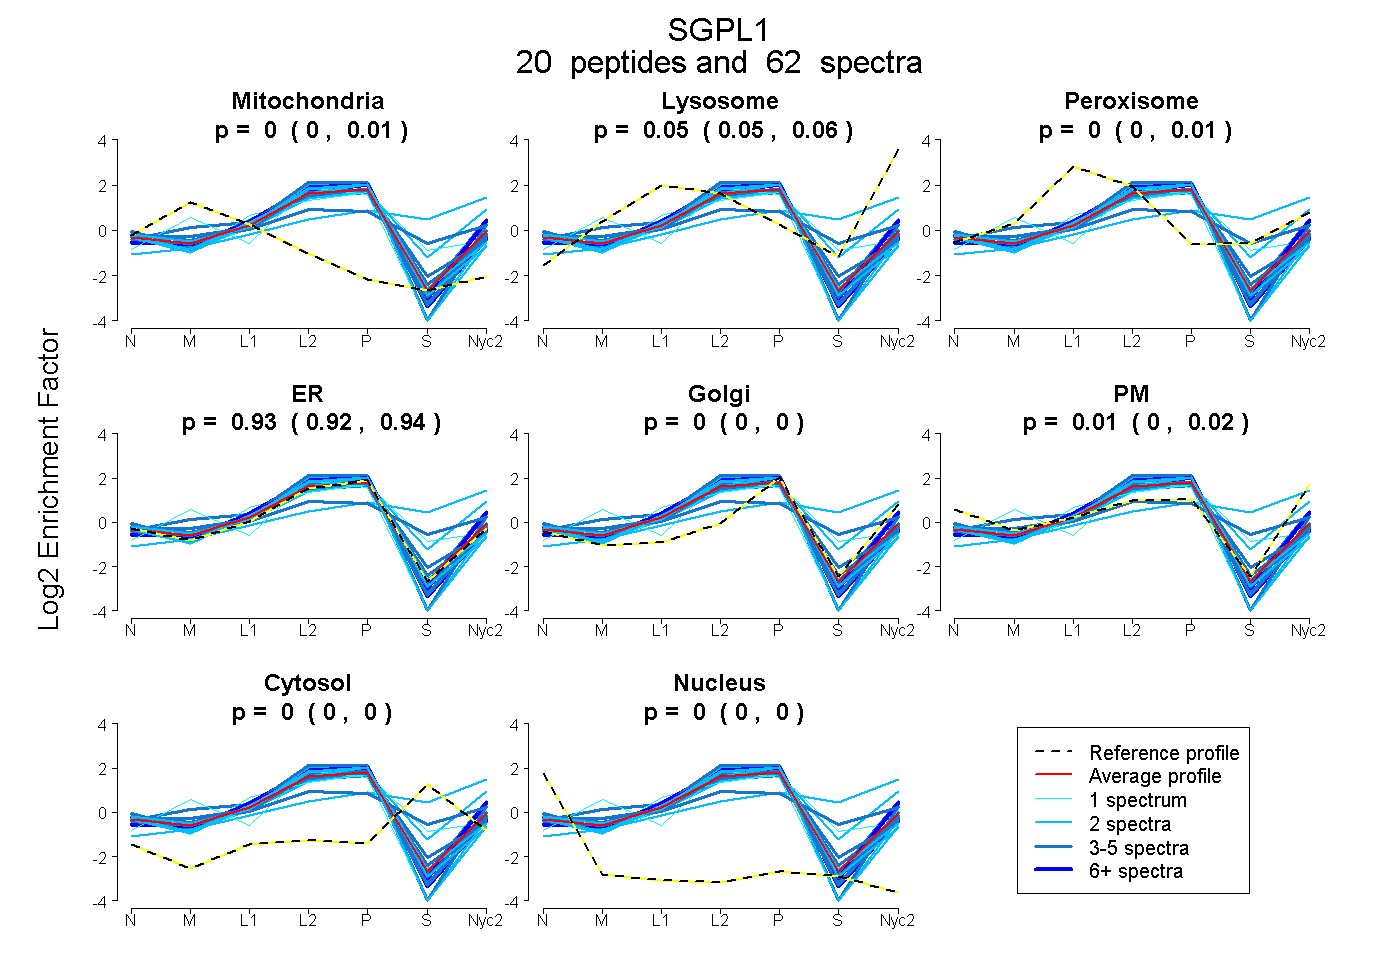
0.000 | 0.007
0.046 | 0.059
0.000 | 0.014
0.919 | 0.936
0.000 | 0.000
0.001 | 0.018
0.000 | 0.000
0.000 | 0.000
9peptides
spectra
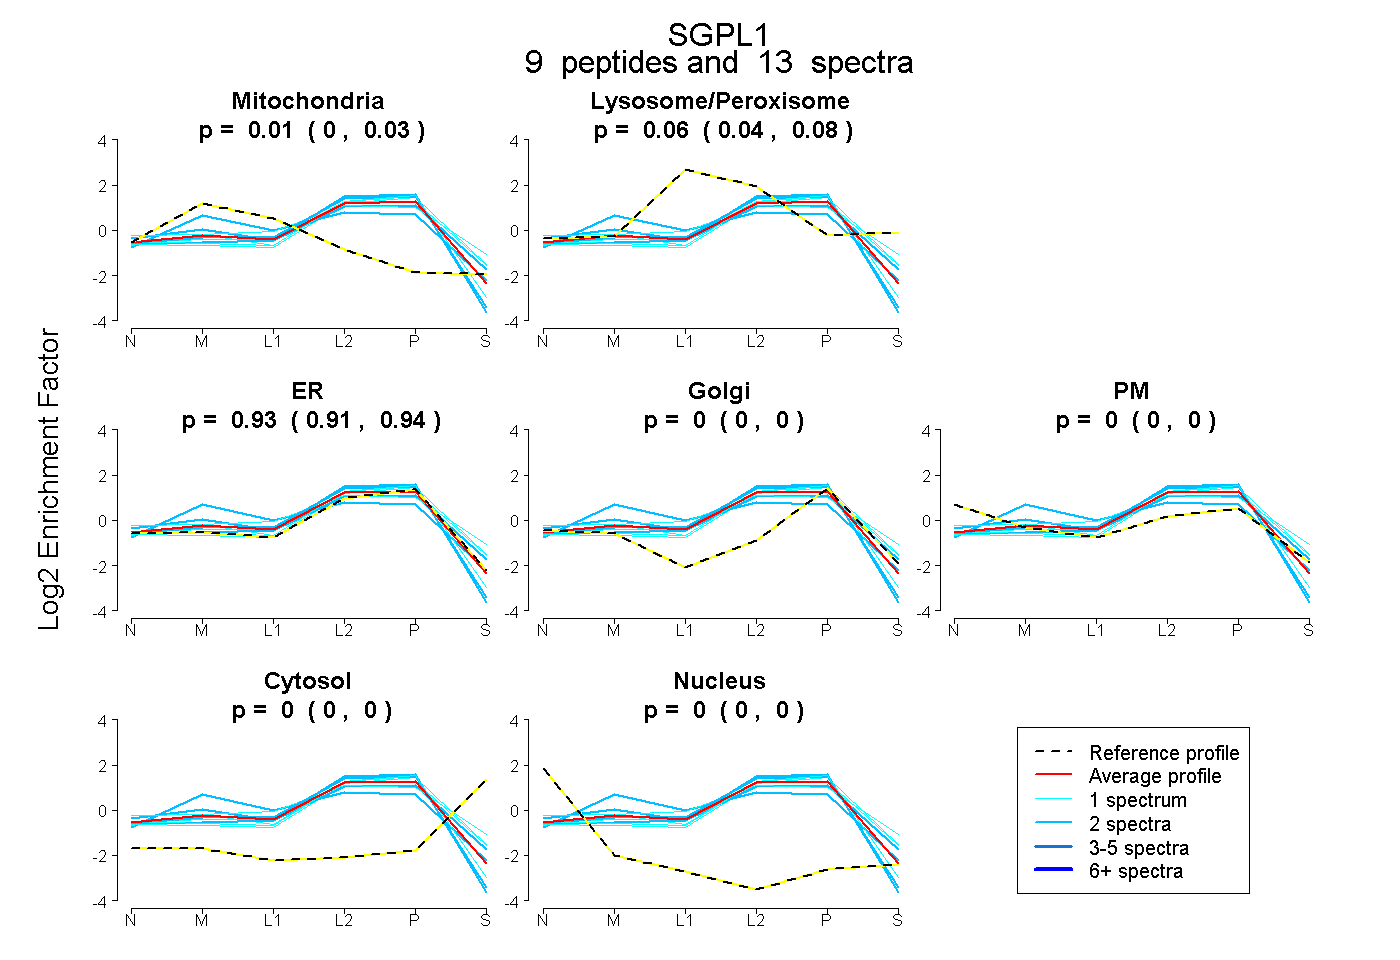
0.000 | 0.025
0.038 | 0.081
0.907 | 0.940
0.000 | 0.000
0.000 | 0.000
0.000 | 0.000
0.000 | 0.000
18peptides
spectra
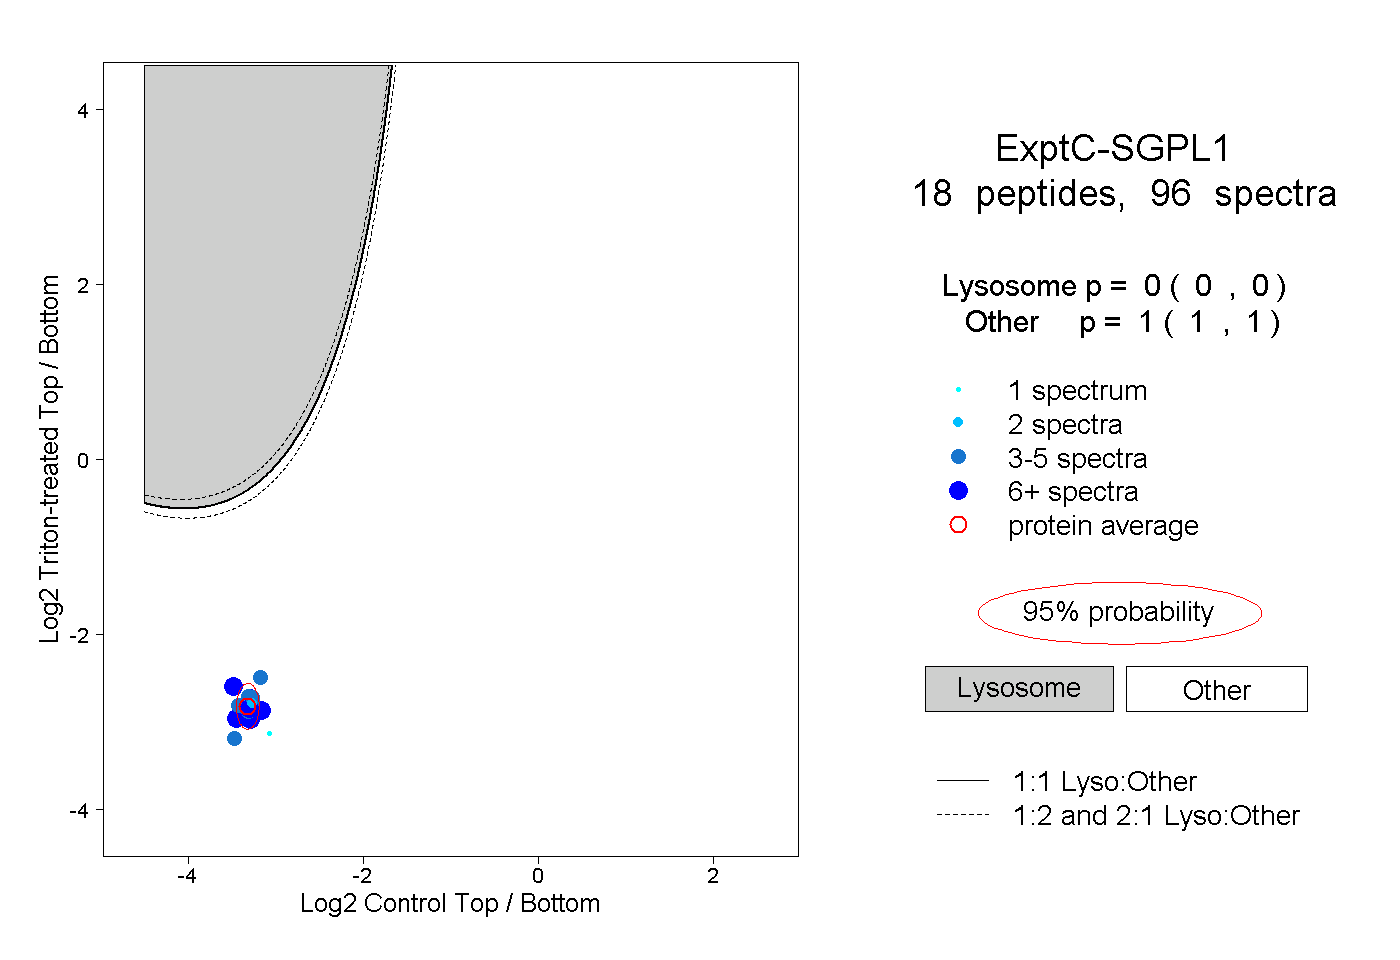
0.000 | 0.000
1.000 | 1.000
6peptides
spectra
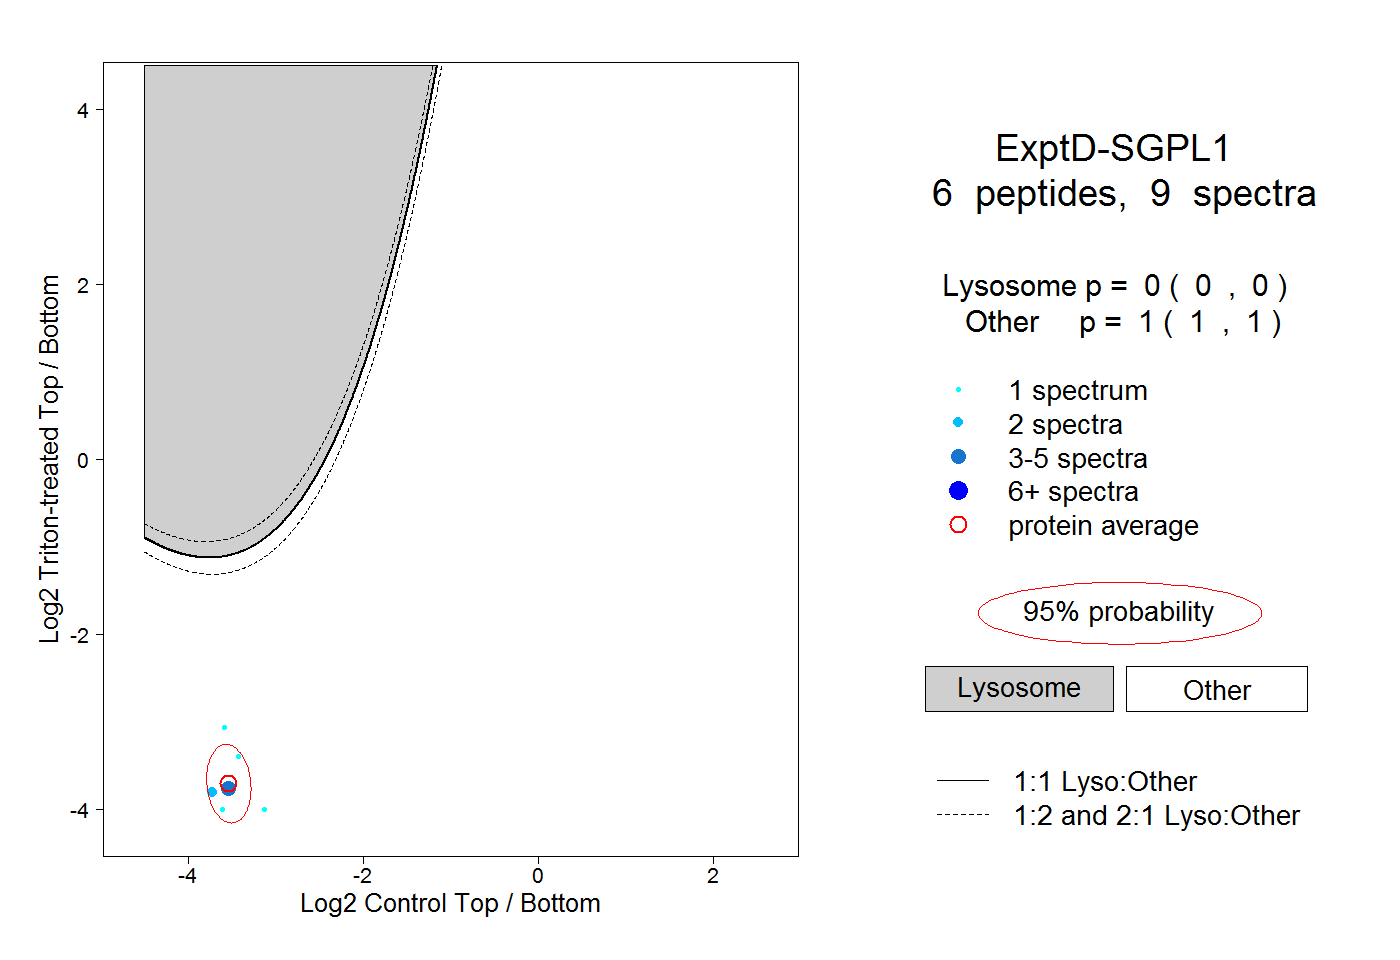
0.000 | 0.000
1.000 | 1.000