SGPL1
[ENSRNOP00000059089]
Main page
| | | Plot |
Mito |
Lyso |
|
Perox |
ER |
Golgi |
PM |
Cytosol |
Nucleus |
|
| Expt A |
 20
20
peptides |
62
spectra |
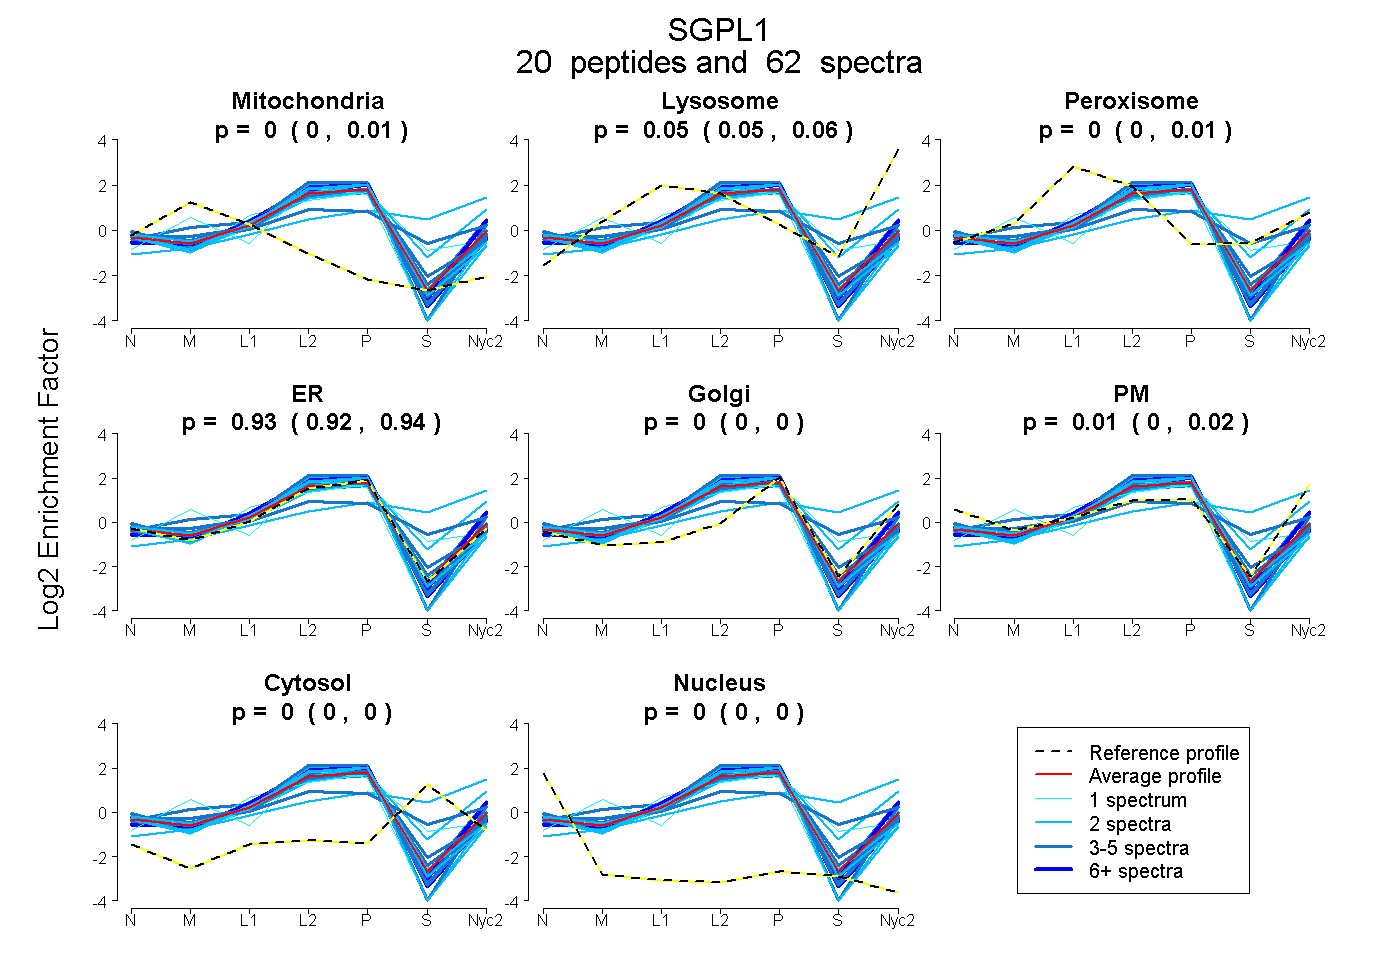 |
0.003
0.000 | 0.007 |
0.054
0.046 | 0.059 |
|
0.004
0.000 | 0.014 |
0.929
0.919 | 0.936 |
0.000
0.000 | 0.000 |
0.010
0.001 | 0.018 |
0.000
0.000 | 0.000 |
0.000
0.000 | 0.000 |
|
| | | Plot |
Mito |
|
Lyso or Perox |
|
ER |
Golgi |
PM |
Cytosol |
Nucleus |
|
| Expt B |
9
peptides |
13
spectra |
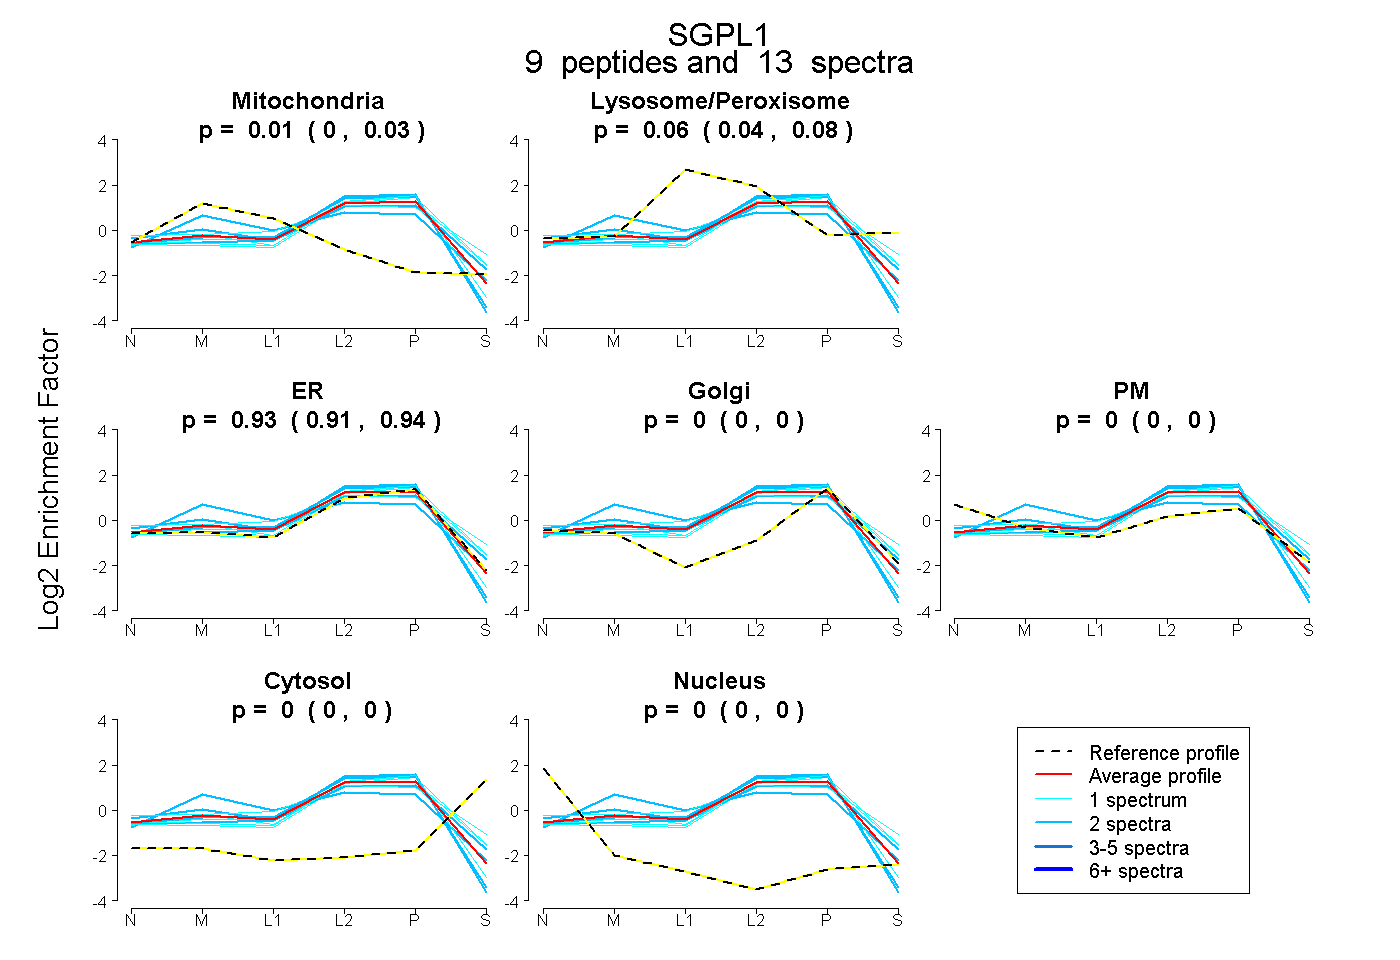 |
0.012
0.000 | 0.025 |
|
0.062
0.038 | 0.081 |
|
0.926
0.907 | 0.940 |
0.000
0.000 | 0.000 |
0.000
0.000 | 0.000 |
0.000
0.000 | 0.000 |
0.000
0.000 | 0.000 |
|
| 1 spectrum, LEAEIVR |
0.000 |
|
0.000 |
|
1.000 |
0.000 |
0.000 |
0.000 |
0.000 |
|
| 1 spectrum, NMEVDVR |
0.000 |
|
0.107 |
|
0.873 |
0.000 |
0.000 |
0.020 |
0.000 |
|
| 2 spectra, MPFIGR |
0.268 |
|
0.070 |
|
0.662 |
0.000 |
0.000 |
0.000 |
0.000 |
|
| 2 spectra, SEIENIK |
0.000 |
|
0.000 |
|
1.000 |
0.000 |
0.000 |
0.000 |
0.000 |
|
| 1 spectrum, YGYAPK |
0.000 |
|
0.000 |
|
1.000 |
0.000 |
0.000 |
0.000 |
0.000 |
|
| 2 spectra, VAIQFLK |
0.000 |
|
0.000 |
|
1.000 |
0.000 |
0.000 |
0.000 |
0.000 |
|
| 1 spectrum, AGYPLEKPFDFR |
0.000 |
|
0.067 |
|
0.895 |
0.000 |
0.000 |
0.038 |
0.000 |
|
| 2 spectra, GWNFNYLQFPR |
0.045 |
|
0.114 |
|
0.731 |
0.000 |
0.109 |
0.000 |
0.000 |
|
| 1 spectrum, NYVNGYCTK |
0.000 |
|
0.331 |
|
0.393 |
0.181 |
0.095 |
0.000 |
0.000 |
|
| | | Plot |
|
Lyso |
|
|
|
|
|
|
|
Other |
| Expt C |
18
peptides |
96
spectra |
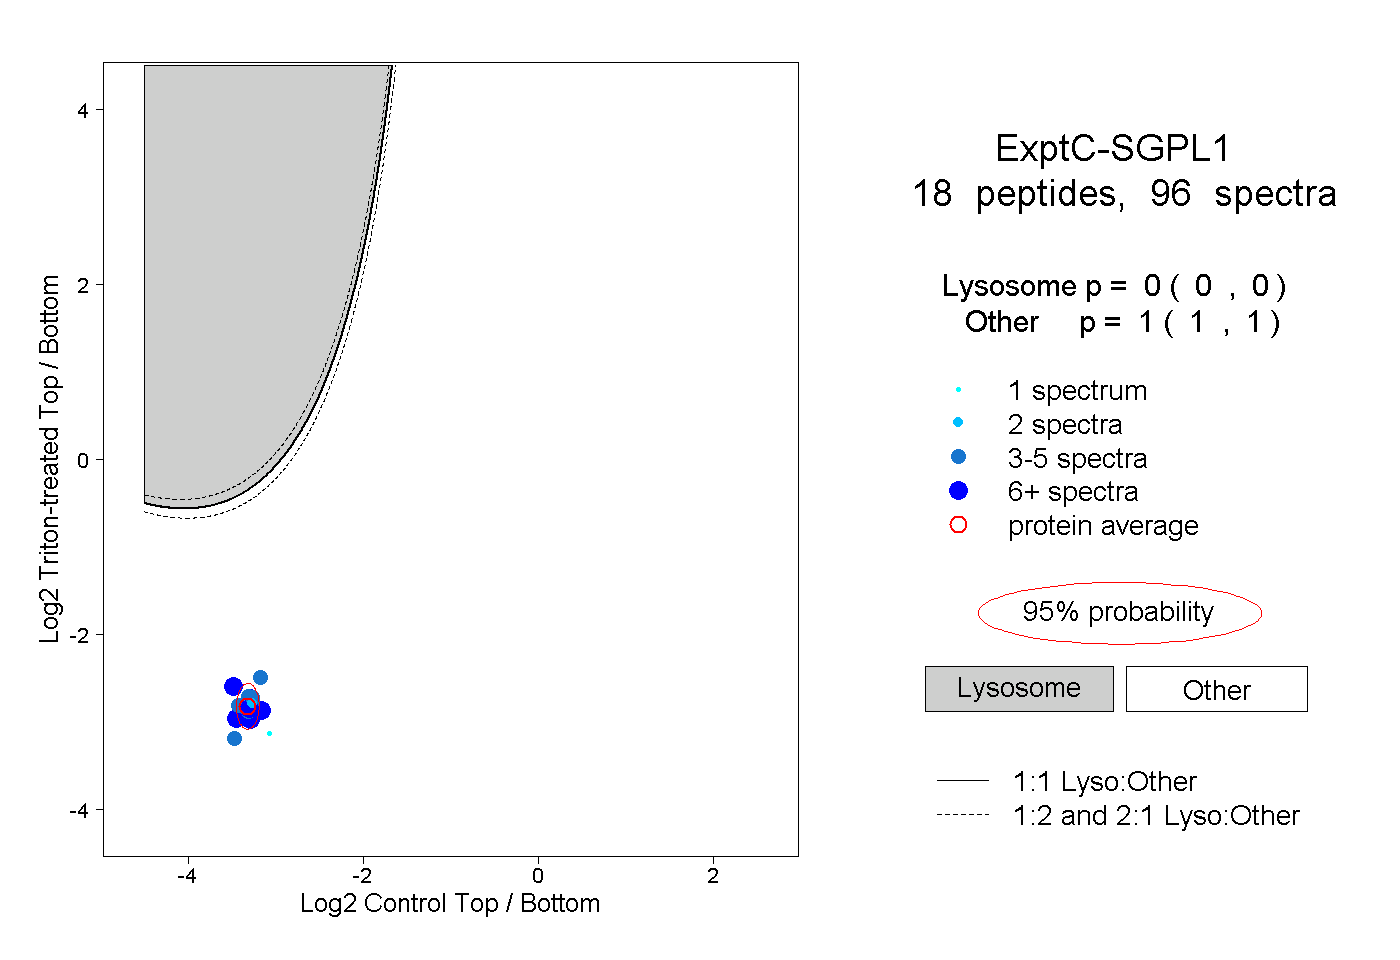 |
|
0.000
0.000 | 0.000 |
|
|
|
|
|
|
|
1.000
1.000 | 1.000 |
| | | Plot |
|
Lyso |
|
|
|
|
|
|
|
Other |
| Expt D |
6
peptides |
9
spectra |
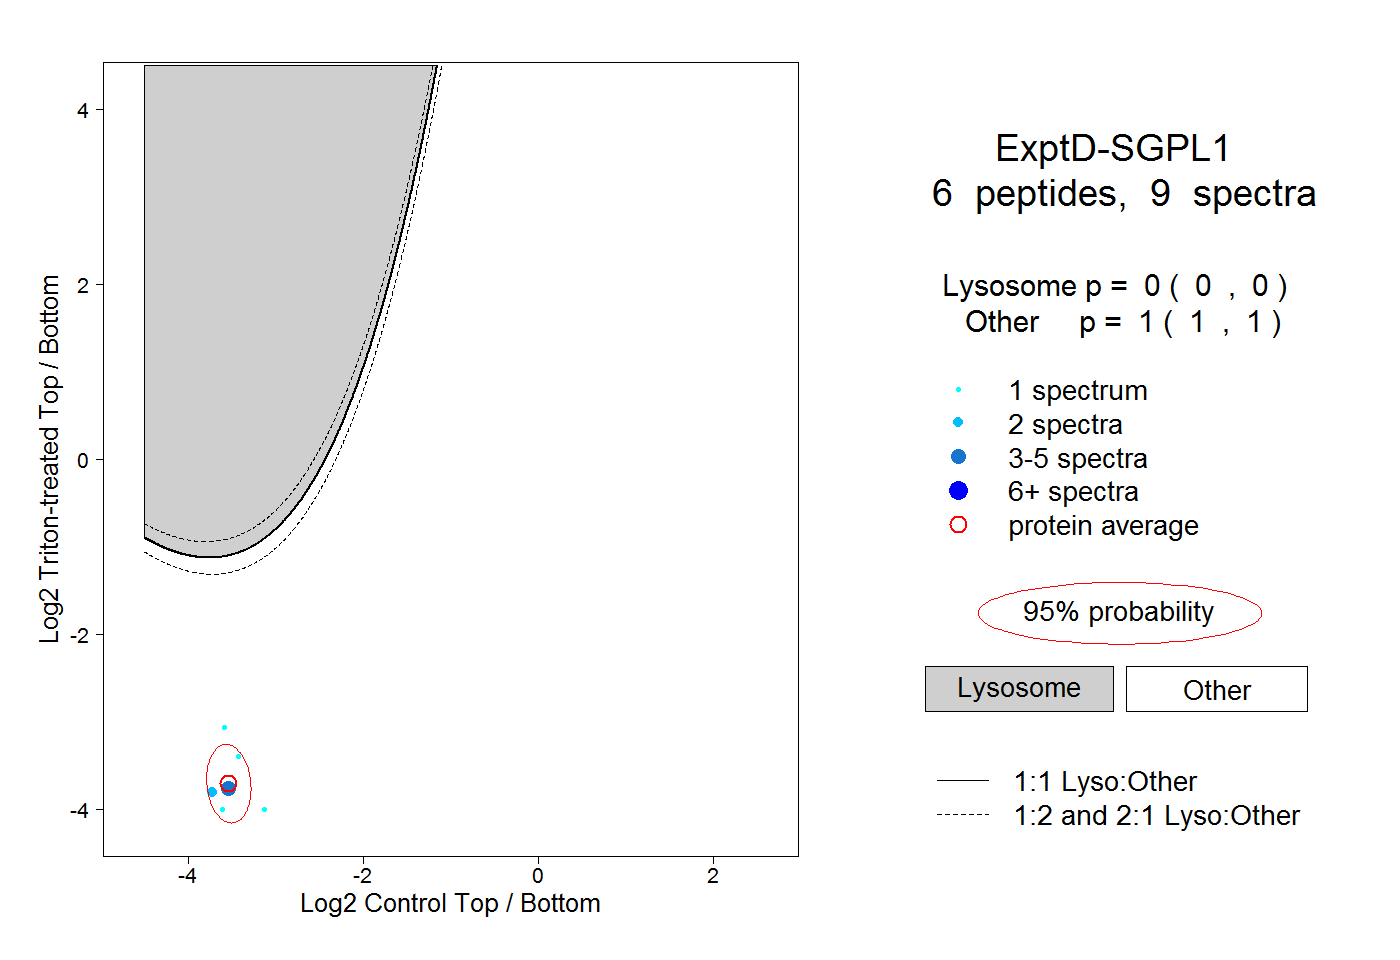 |
|
0.000
0.000 | 0.000 |
|
|
|
|
|
|
|
1.000
1.000 | 1.000 |