 36
36peptides
spectra
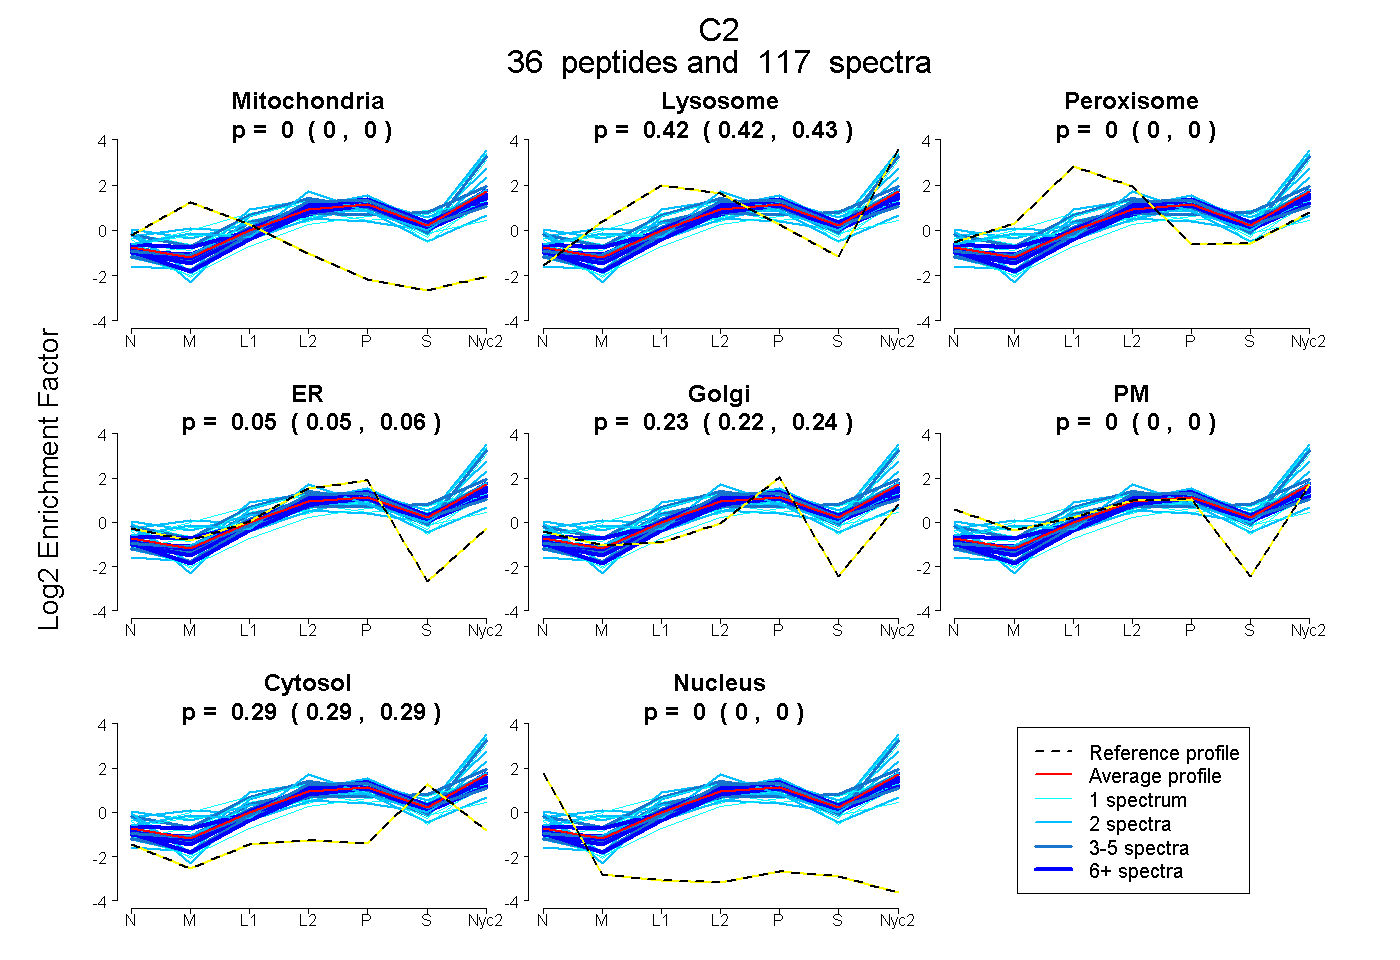
0.000 | 0.000
0.420 | 0.426
0.000 | 0.000
0.045 | 0.060
0.225 | 0.238
0.000 | 0.000
0.290 | 0.294
0.000 | 0.000
10peptides
spectra
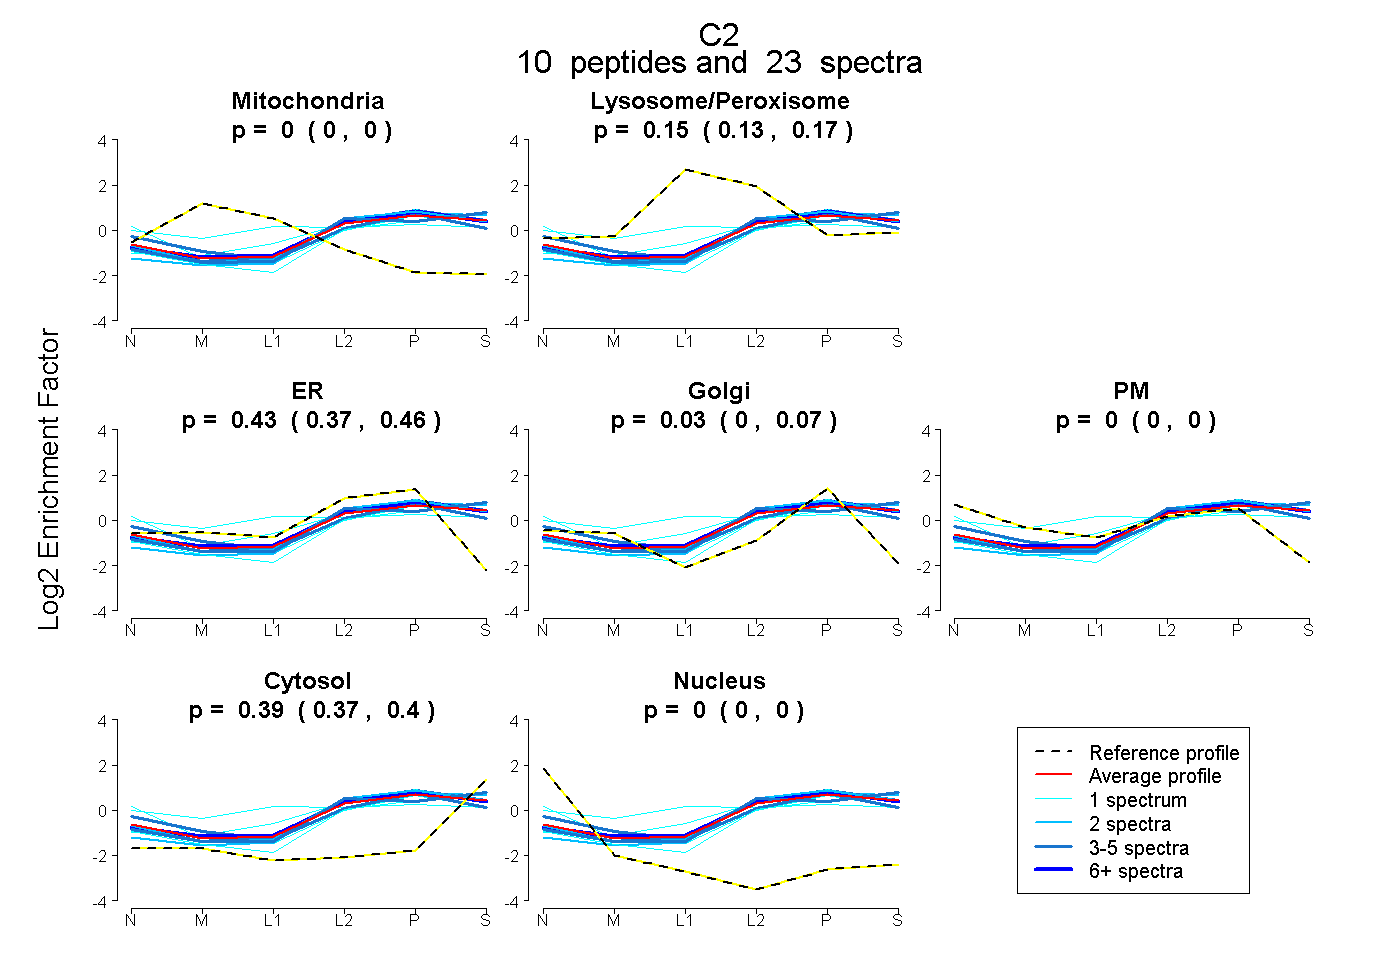
0.000 | 0.000
0.134 | 0.173
0.375 | 0.460
0.000 | 0.067
0.000 | 0.000
0.373 | 0.400
0.000 | 0.000
46peptides
spectra
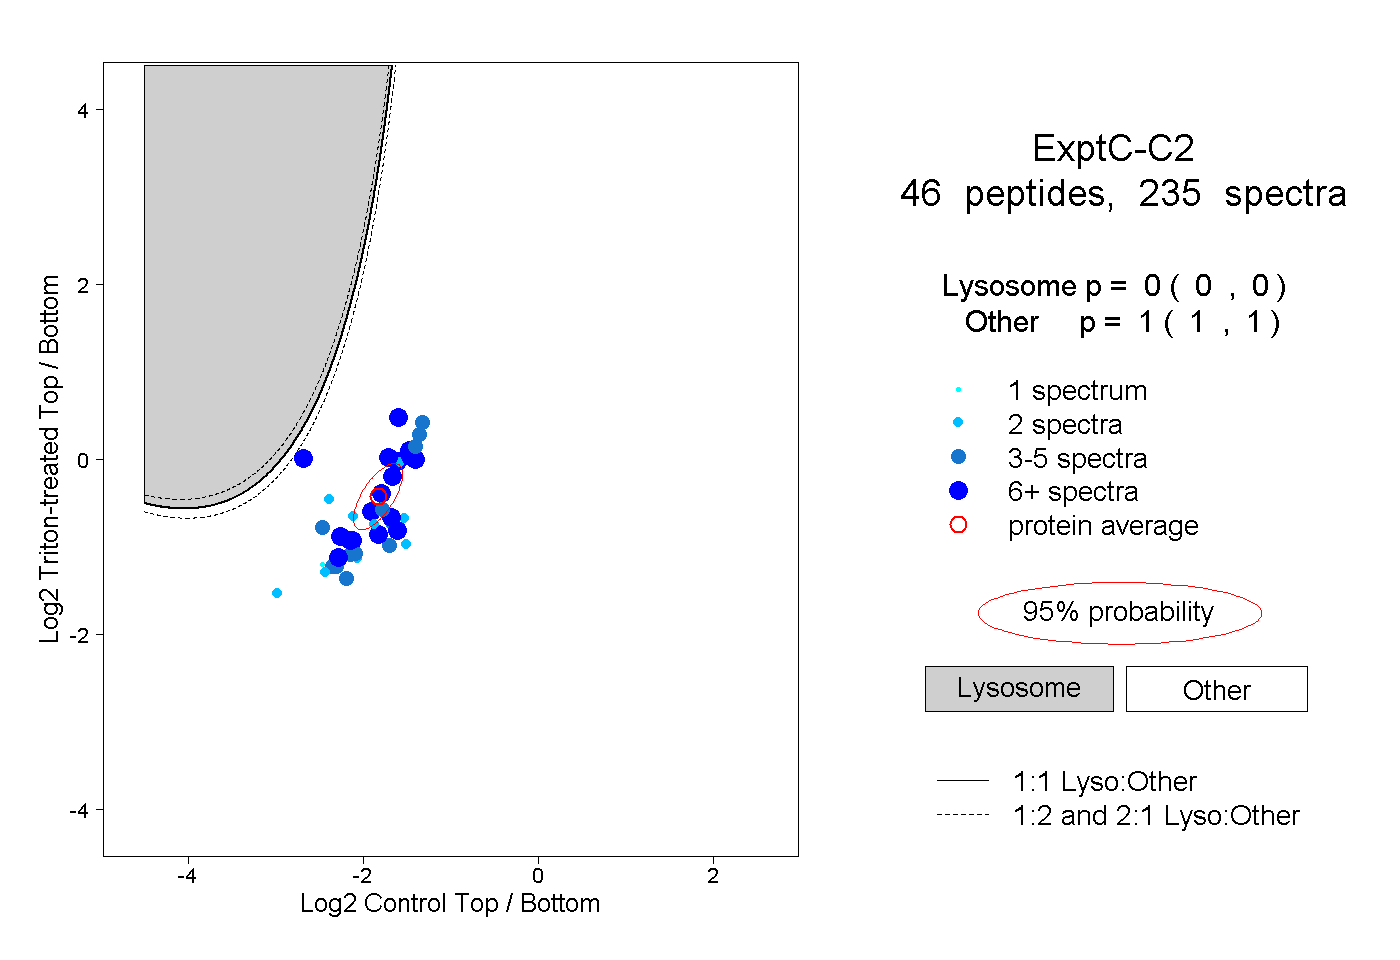
0.000 | 0.000
1.000 | 1.000
13peptides
spectra
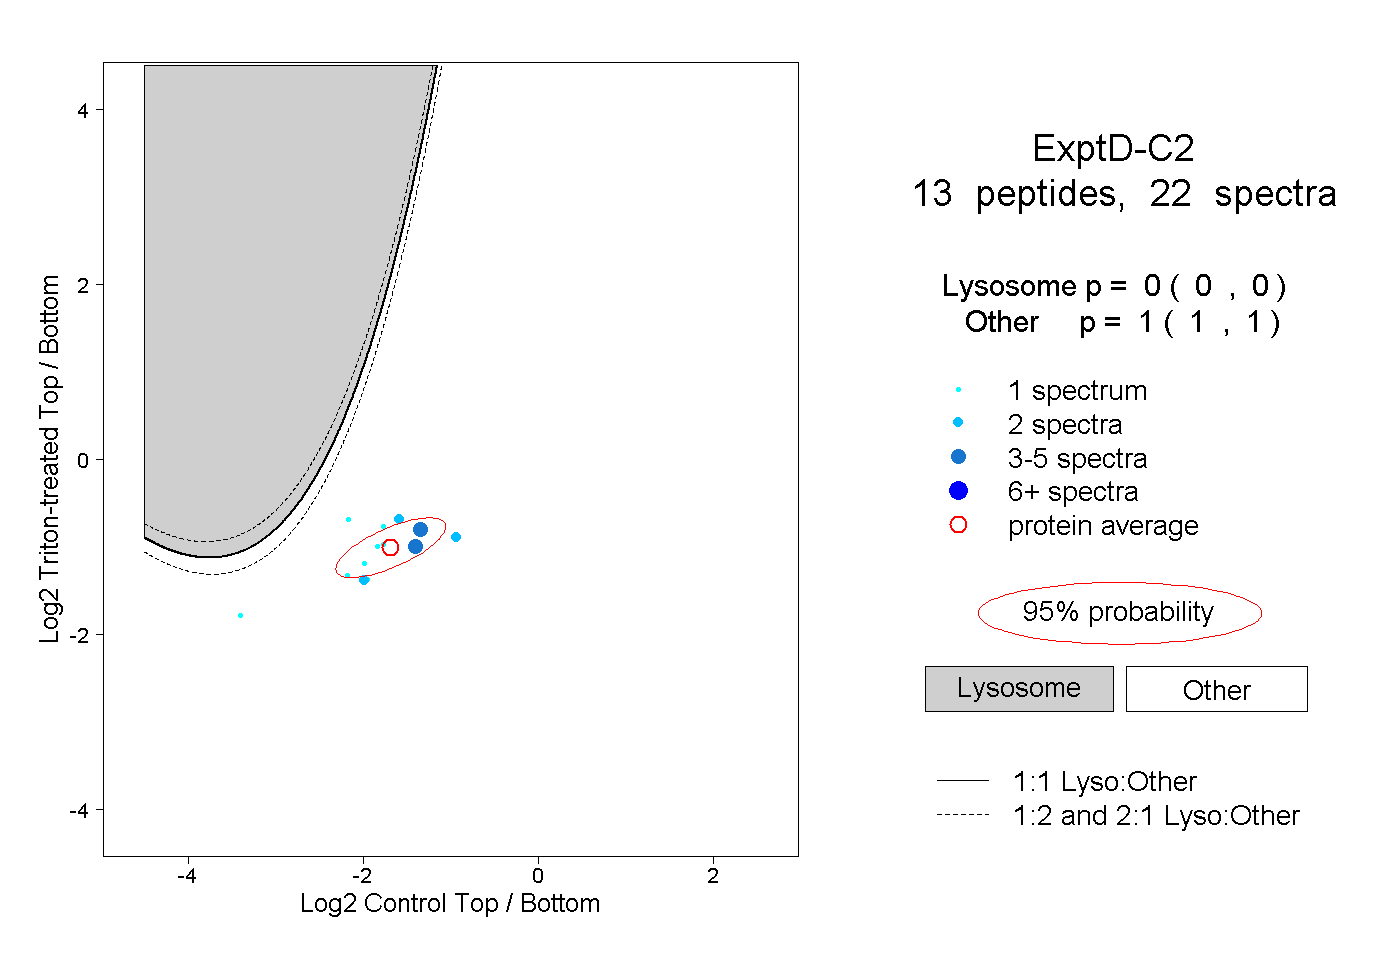
0.000 | 0.000
1.000 | 1.000