 6
6peptides
spectra
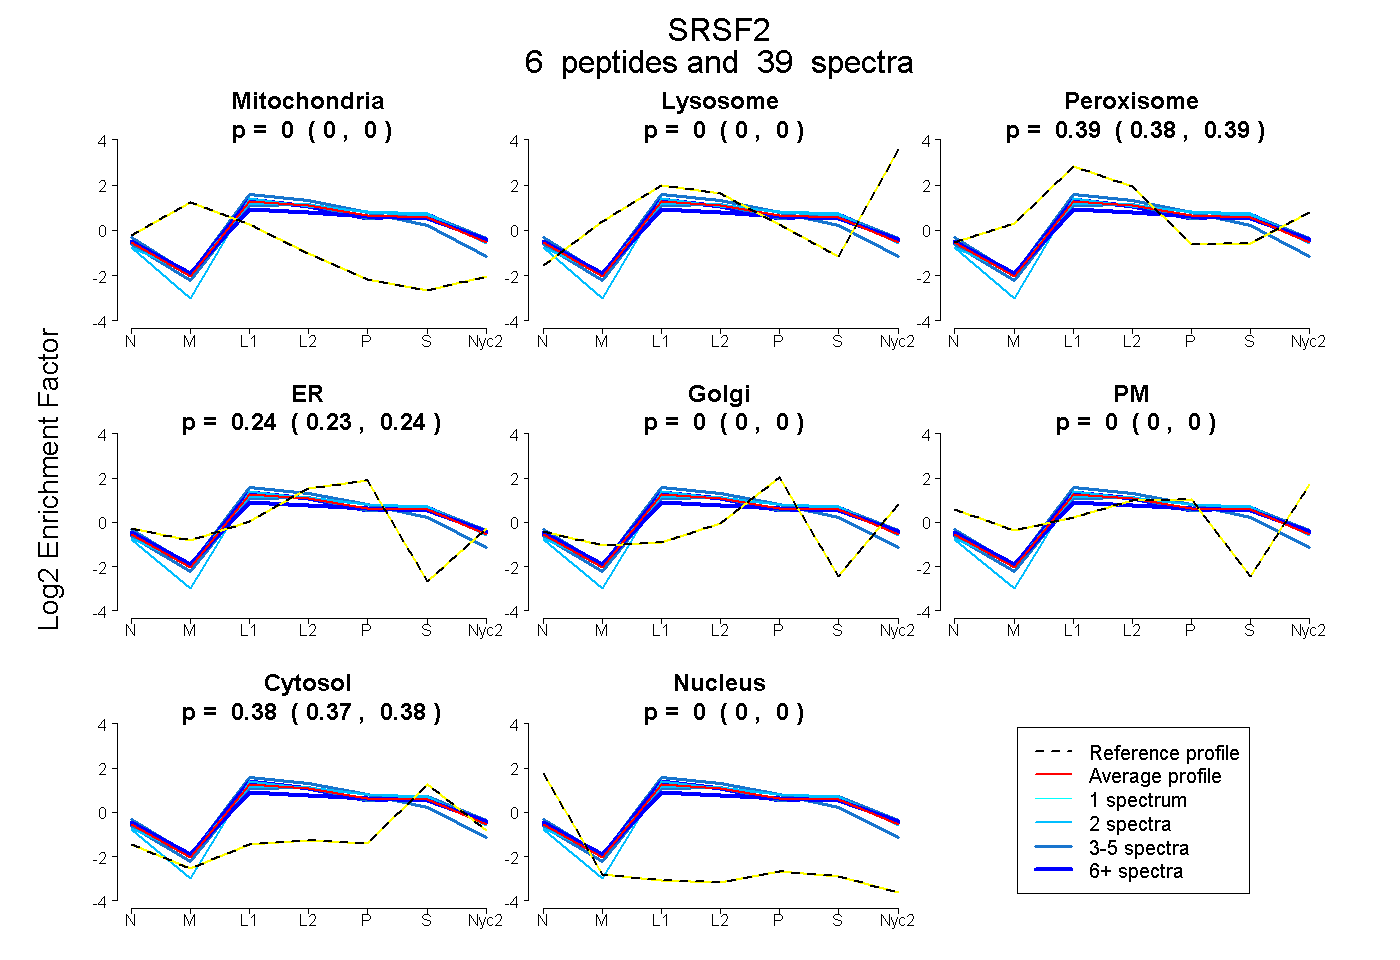
0.000 | 0.000
0.000 | 0.000
0.381 | 0.394
0.230 | 0.239
0.000 | 0.000
0.000 | 0.000
0.371 | 0.380
0.000 | 0.000
4peptides
spectra
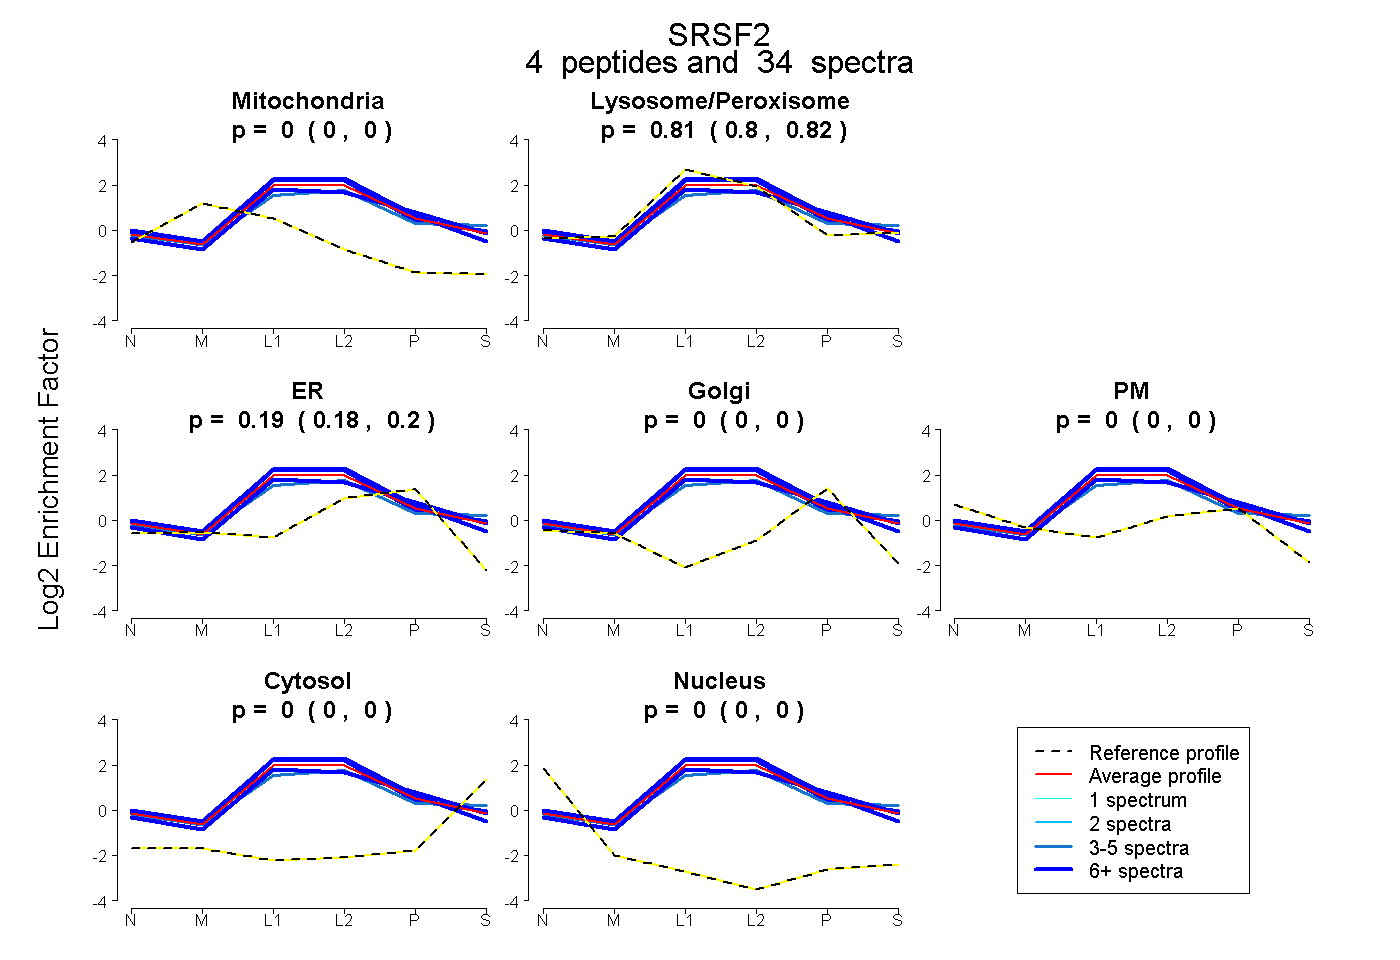
0.000 | 0.000
0.799 | 0.820
0.179 | 0.199
0.000 | 0.000
0.000 | 0.000
0.000 | 0.000
0.000 | 0.000
6peptides
spectra
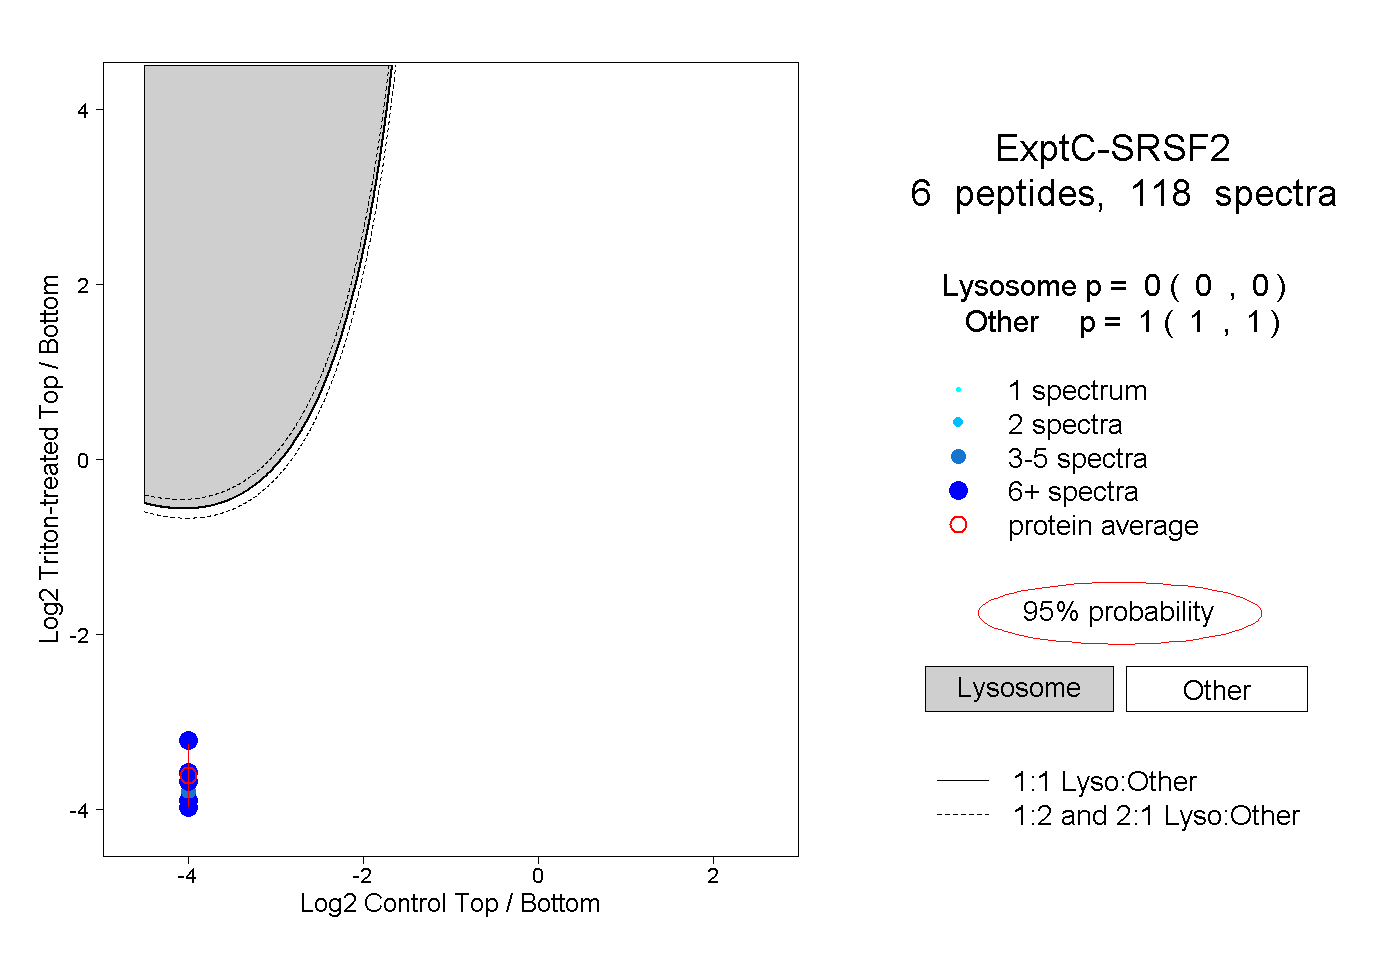
0.000 | 0.000
1.000 | 1.000
4peptides
spectra
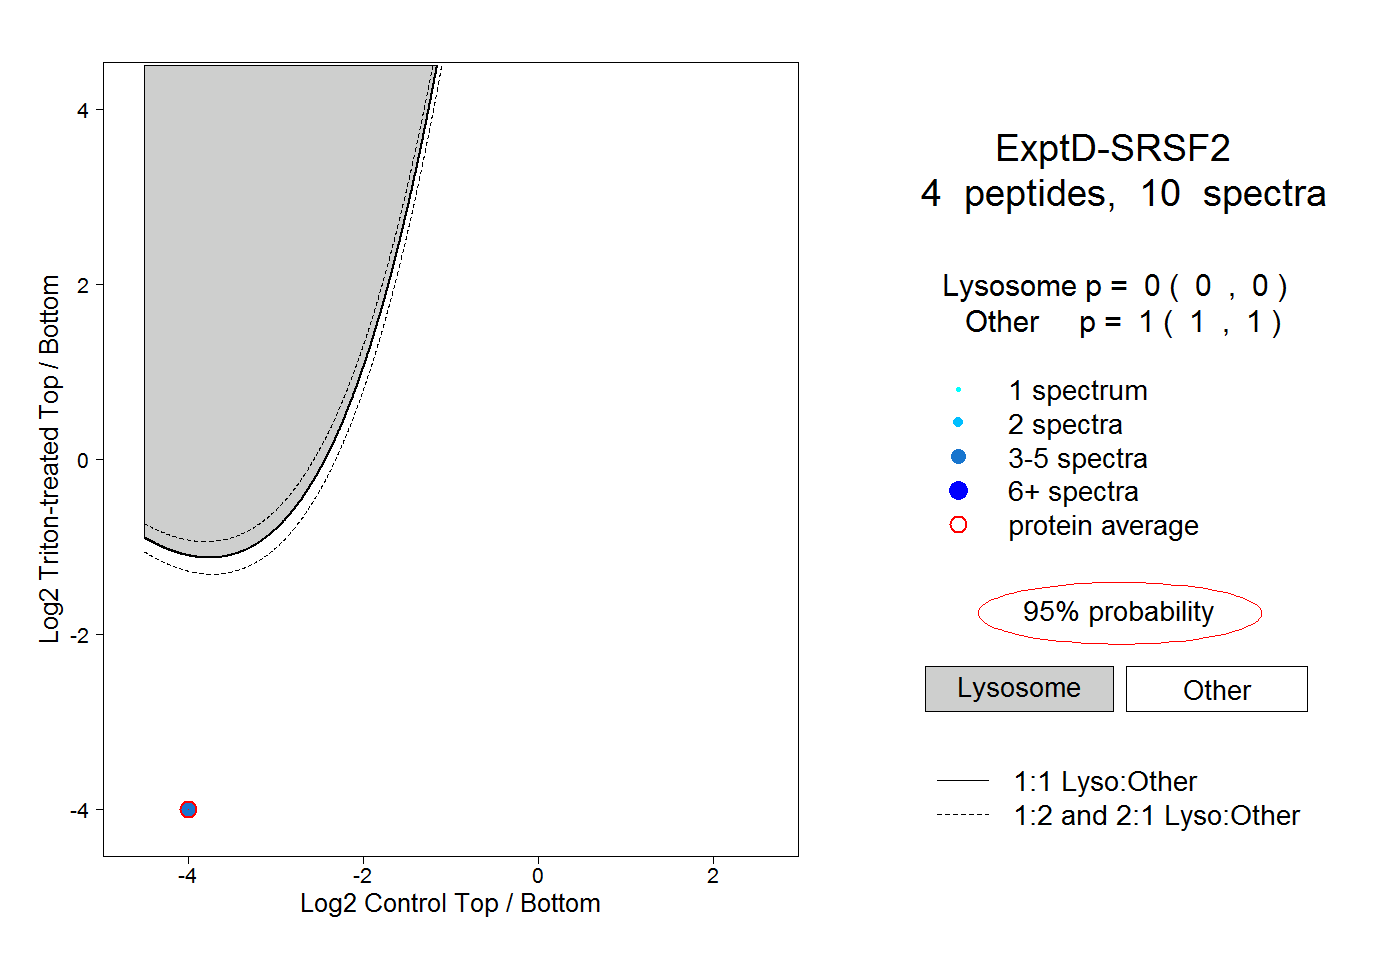
0.000 | 0.000
1.000 | 1.000