 6
6peptides
spectra
0.000 | 0.000
0.000 | 0.000
0.381 | 0.394
0.230 | 0.239
0.000 | 0.000
0.000 | 0.000
0.371 | 0.380
0.000 | 0.000
| Plot | Mito | Lyso | Perox | ER | Golgi | PM | Cytosol | Nucleus | |||||
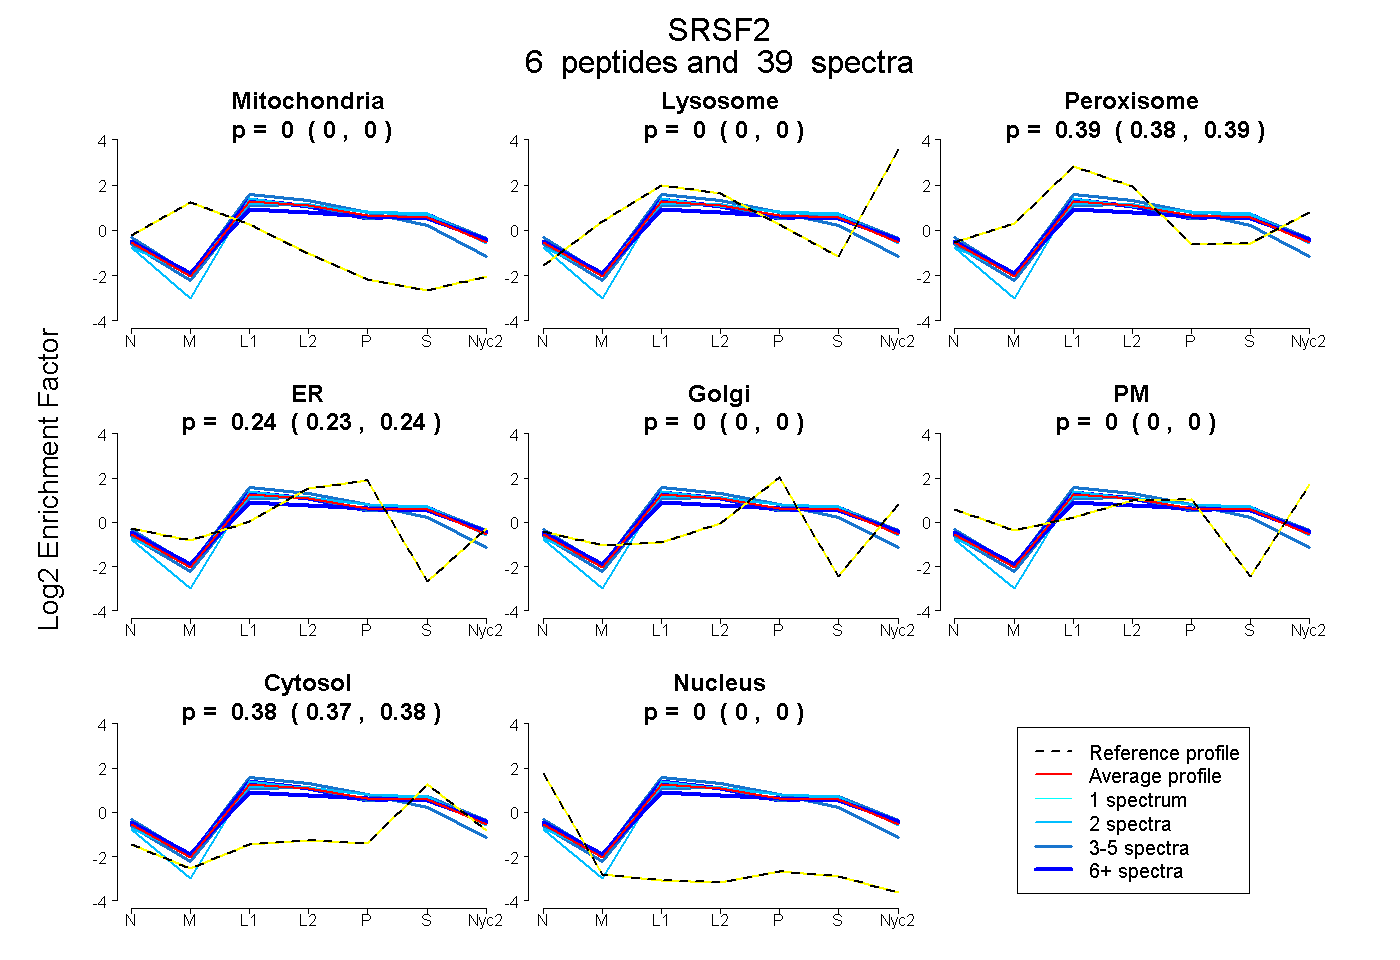
| Expt A |
6 peptides |
39 spectra |
|
0.000 0.000 | 0.000 |
0.000 0.000 | 0.000 |
0.389 0.381 | 0.394 |
0.235 0.230 | 0.239 |
0.000 0.000 | 0.000 |
0.000 0.000 | 0.000 |
0.376 0.371 | 0.380 |
0.000 0.000 | 0.000 |
| 11 spectra, YGGGGYGR | 0.000 | 0.000 | 0.332 | 0.257 | 0.000 | 0.000 | 0.411 | 0.000 | ||
| 4 spectra, DAEDAMDAMDGAVLDGR | 0.000 | 0.000 | 0.385 | 0.315 | 0.000 | 0.000 | 0.299 | 0.000 | ||
| 5 spectra, TSPDTLR | 0.000 | 0.000 | 0.382 | 0.209 | 0.000 | 0.000 | 0.408 | 0.000 | ||
| 15 spectra, GFAFVR | 0.000 | 0.000 | 0.436 | 0.186 | 0.000 | 0.000 | 0.378 | 0.000 | ||
| 2 spectra, VGDVYIPR | 0.000 | 0.000 | 0.327 | 0.241 | 0.000 | 0.000 | 0.432 | 0.000 | ||
| 2 spectra, VDNLTYR | 0.000 | 0.000 | 0.389 | 0.244 | 0.000 | 0.000 | 0.366 | 0.000 |
| Plot | Mito | Lyso or Perox | ER | Golgi | PM | Cytosol | Nucleus | ||||||
| Expt B |
4 peptides |
34 spectra |
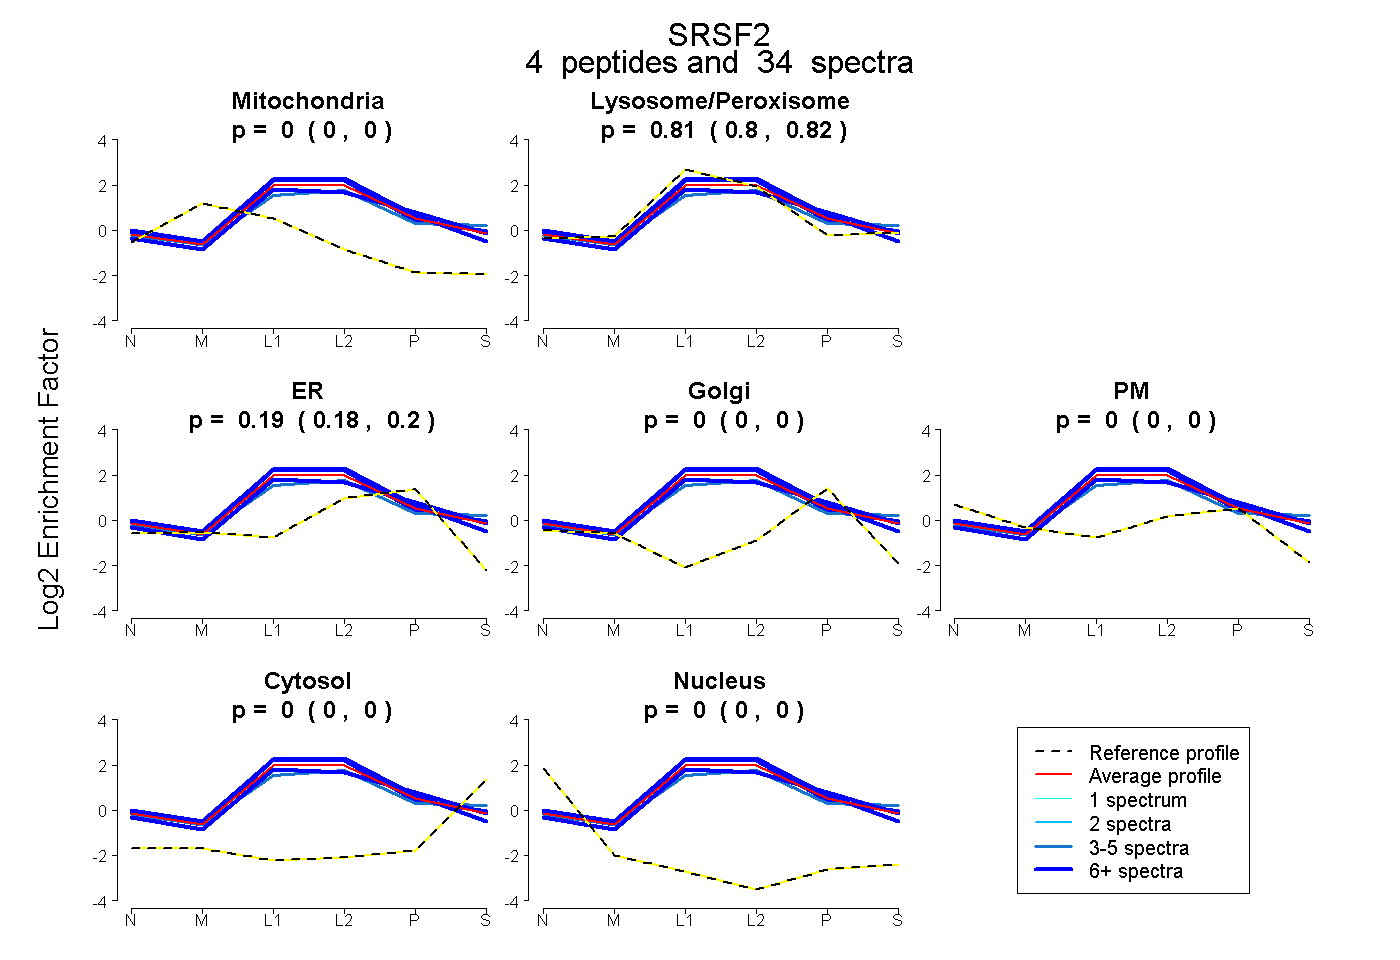 |
0.000 0.000 | 0.000 |
0.811 0.799 | 0.820 |
0.189 0.179 | 0.199 |
0.000 0.000 | 0.000 |
0.000 0.000 | 0.000 |
0.000 0.000 | 0.000 |
0.000 0.000 | 0.000 |
|||
| Plot | Lyso | Other | |||||||||||
| Expt C |
6 peptides |
118 spectra |
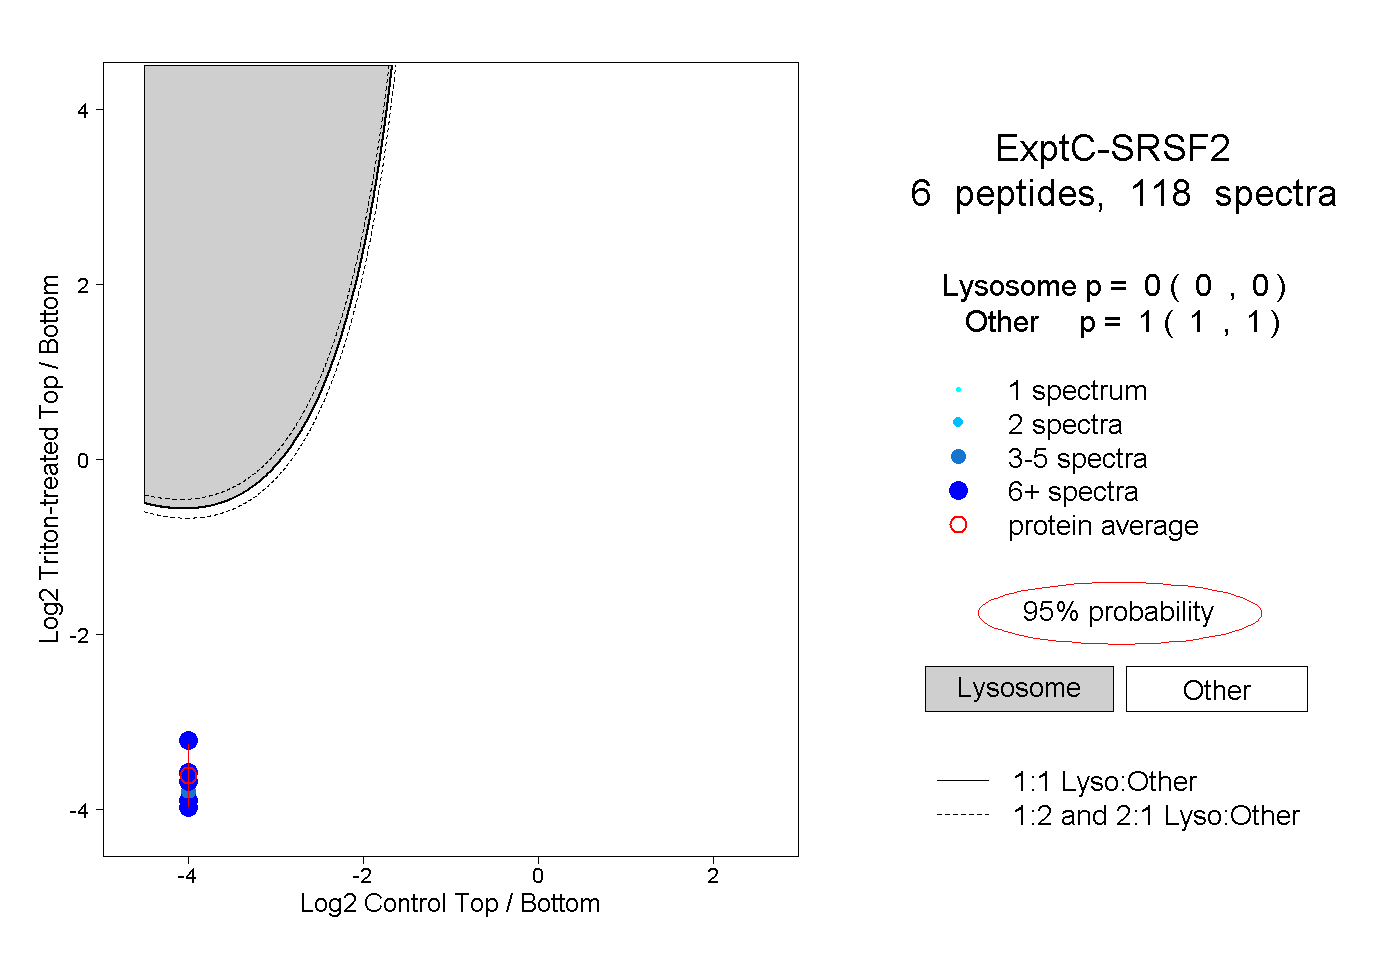 |
0.000 0.000 | 0.000 |
1.000 1.000 | 1.000 |
||||||||
| Plot | Lyso | Other | |||||||||||
| Expt D |
4 peptides |
10 spectra |
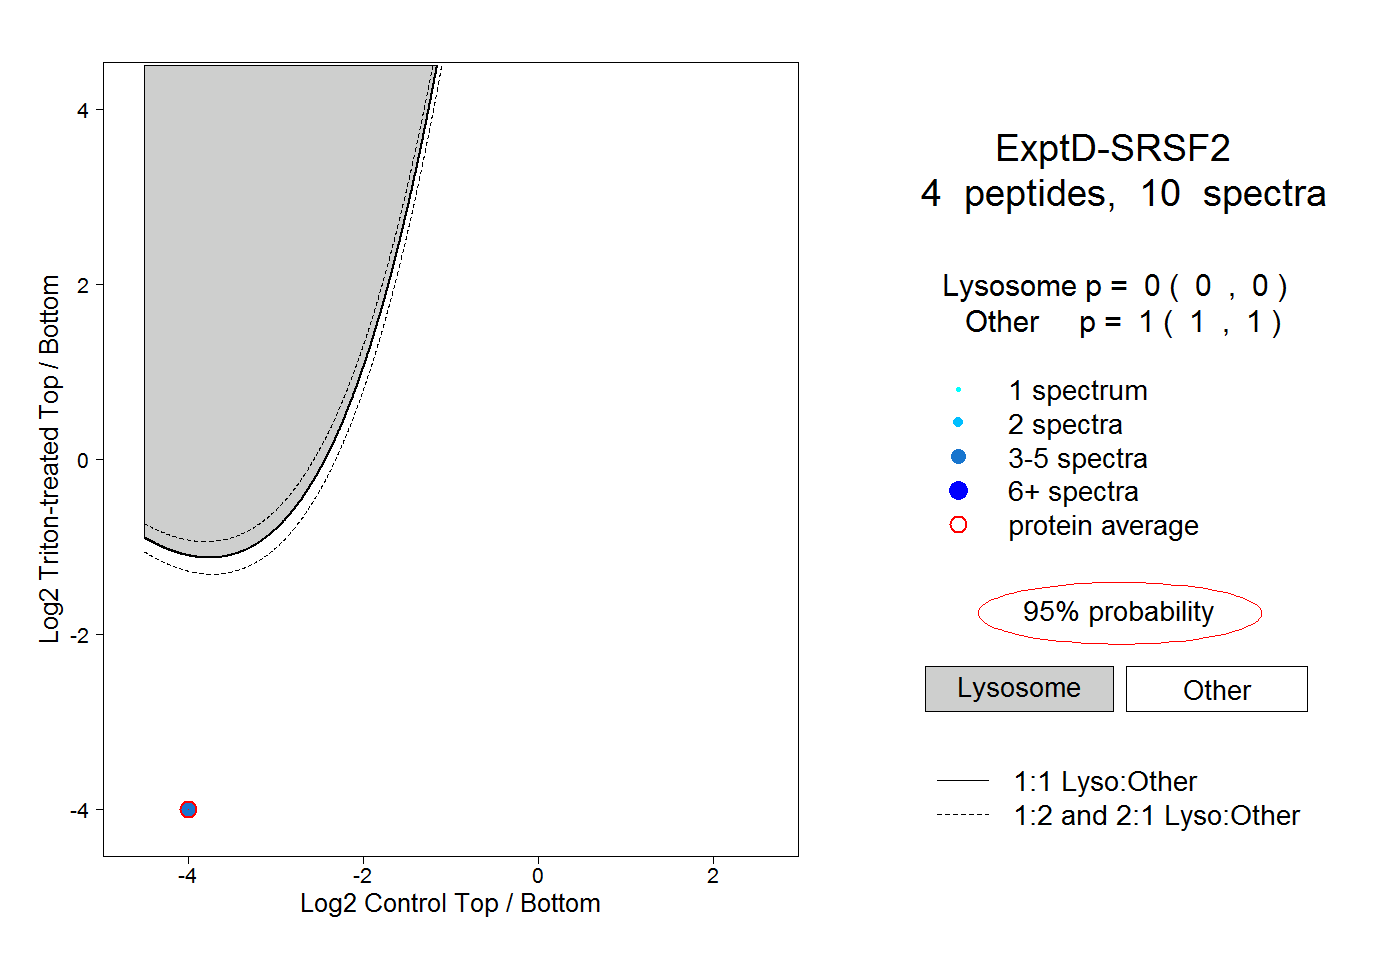 |
0.000 0.000 | 0.000 |
1.000 1.000 | 1.000 |