 6
6peptides
spectra
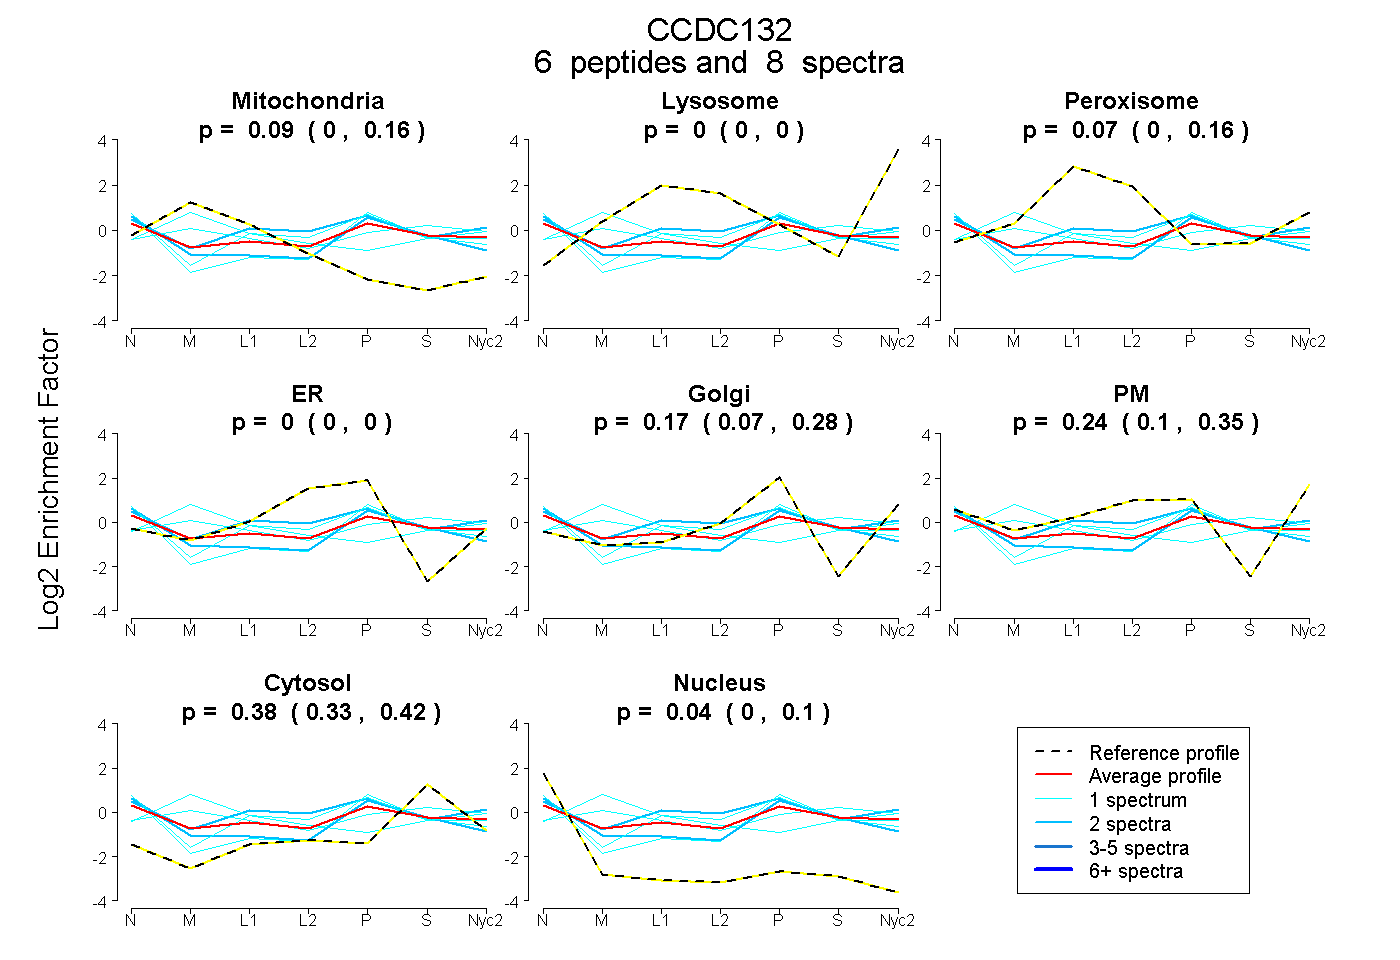
0.000 | 0.156
0.000 | 0.000
0.000 | 0.164
0.000 | 0.000
0.071 | 0.277
0.096 | 0.347
0.331 | 0.418
0.000 | 0.098
2peptides
spectra
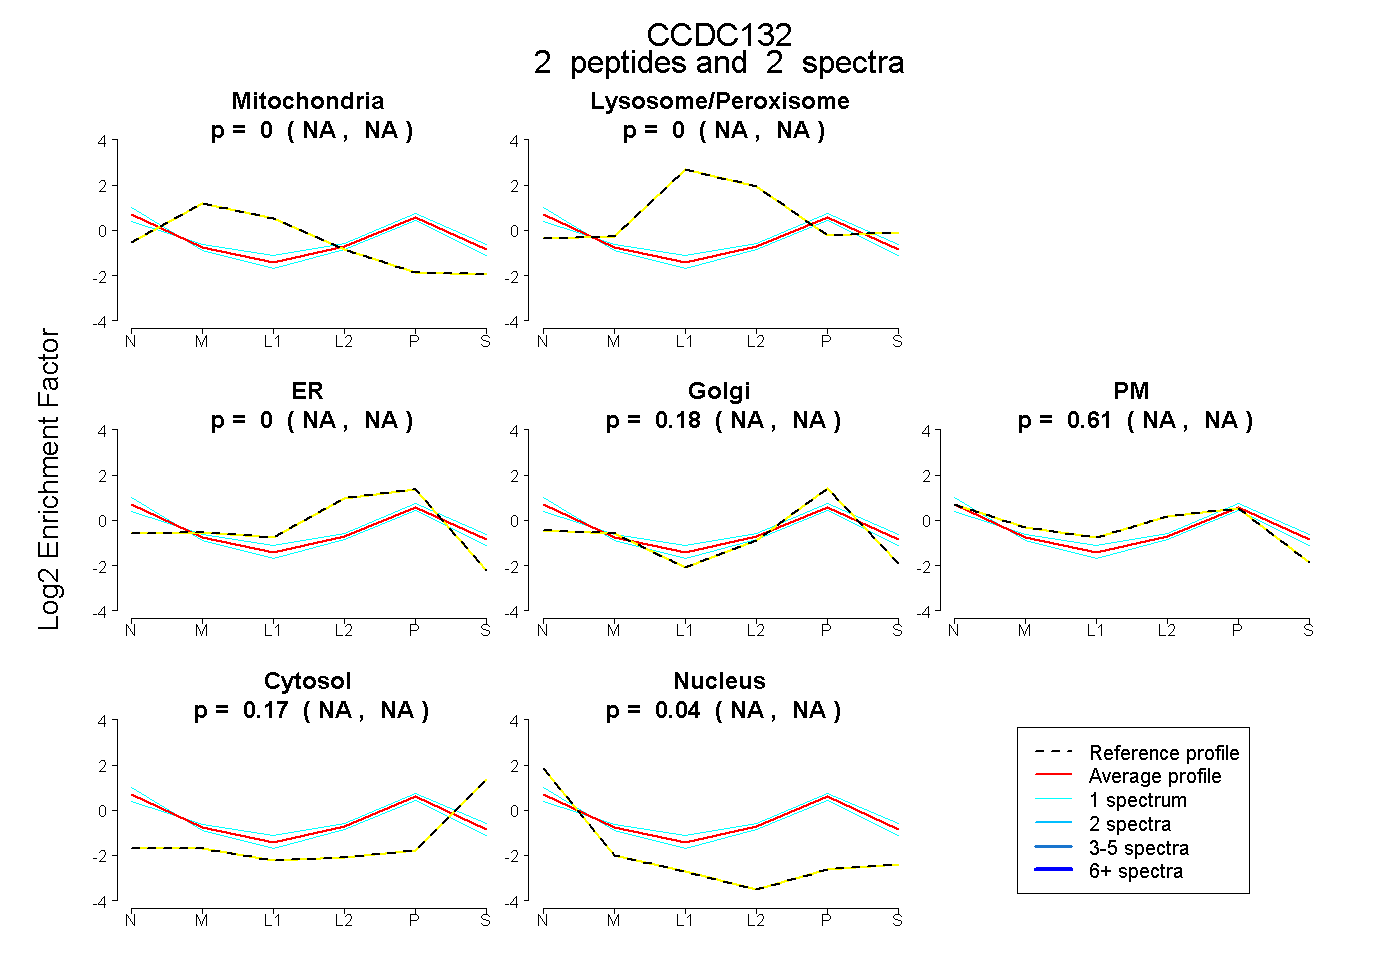
NA | NA
NA | NA
NA | NA
NA | NA
NA | NA
NA | NA
NA | NA
2peptides
spectra
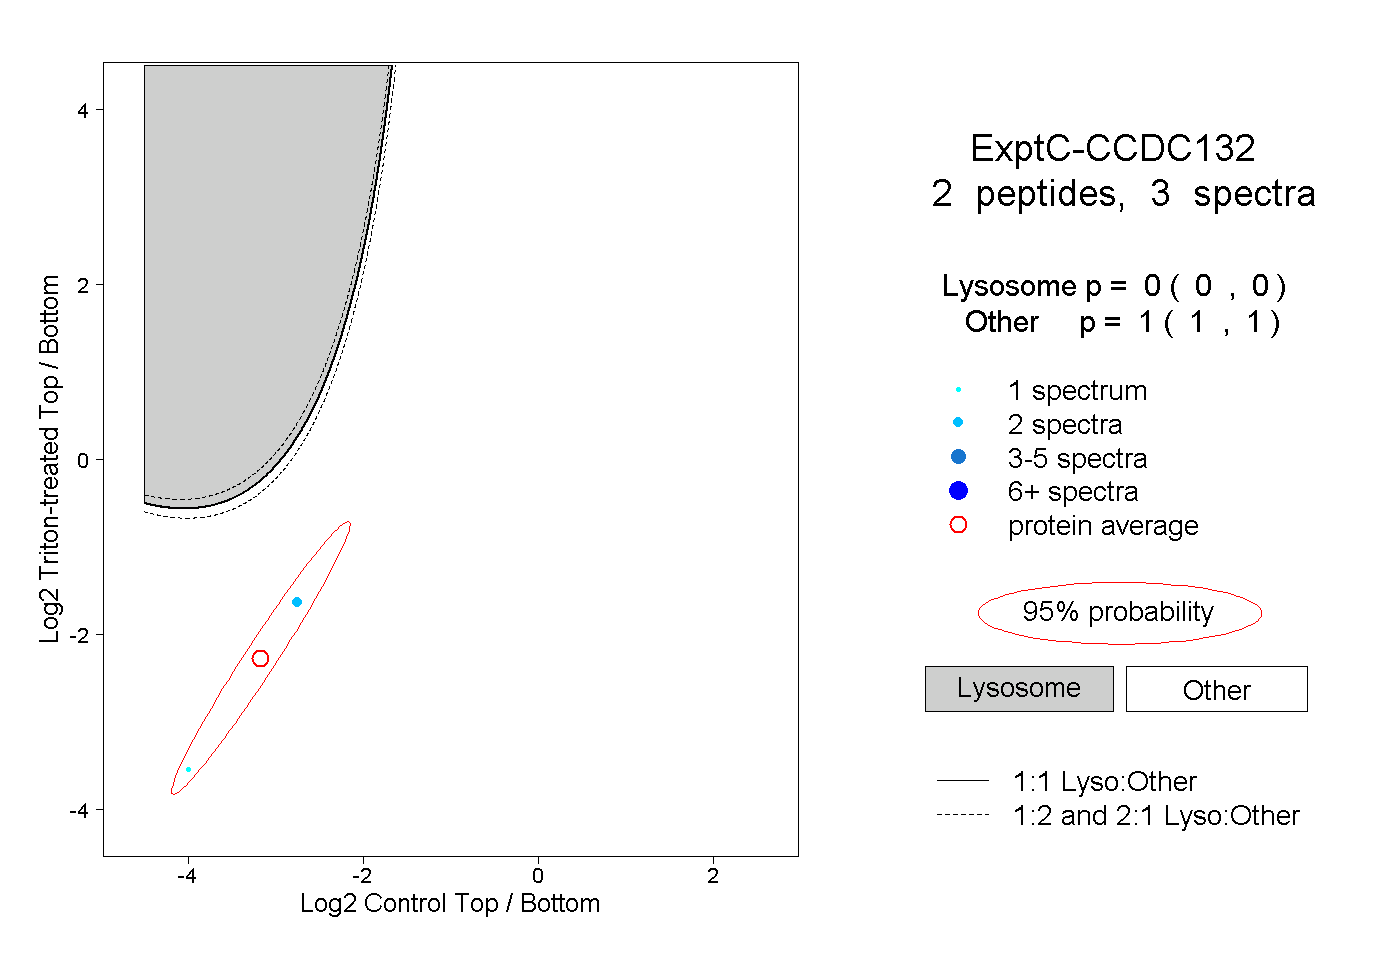
0.000 | 0.000
1.000 | 1.000