 6
6peptides
spectra
0.000 | 0.156
0.000 | 0.000
0.000 | 0.164
0.000 | 0.000
0.071 | 0.277
0.096 | 0.347
0.331 | 0.418
0.000 | 0.098
2peptides
spectra
NA | NA
NA | NA
NA | NA
NA | NA
NA | NA
NA | NA
NA | NA
| Plot | Mito | Lyso | Perox | ER | Golgi | PM | Cytosol | Nucleus | |||||
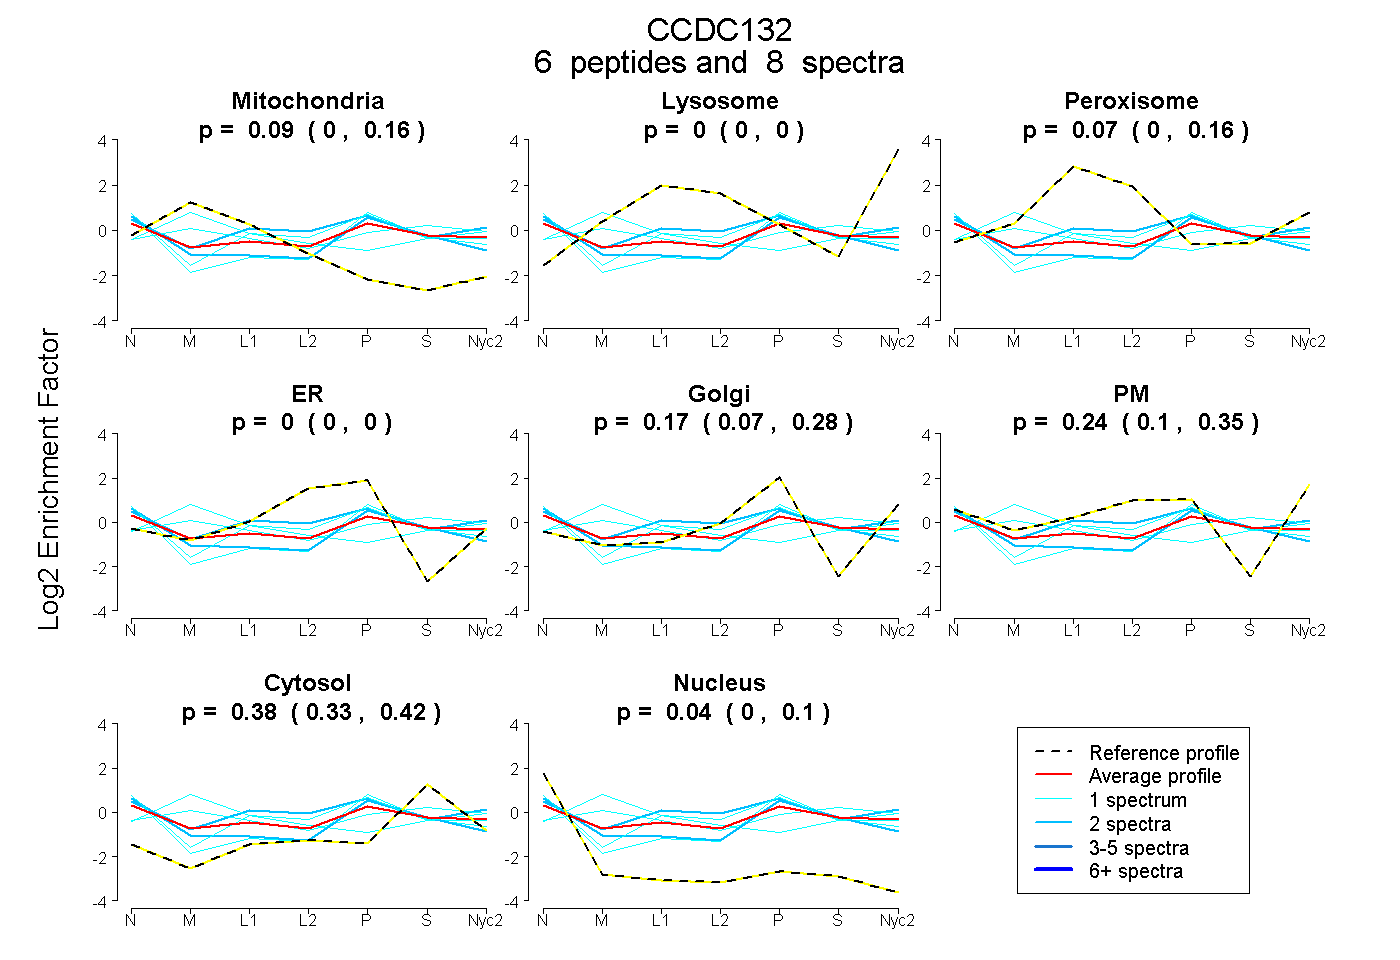
| Expt A |
6 peptides |
8 spectra |
|
0.089 0.000 | 0.156 |
0.000 0.000 | 0.000 |
0.068 0.000 | 0.164 |
0.000 0.000 | 0.000 |
0.172 0.071 | 0.277 |
0.244 0.096 | 0.347 |
0.384 0.331 | 0.418 |
0.042 0.000 | 0.098 |
||
| Plot | Mito | Lyso or Perox | ER | Golgi | PM | Cytosol | Nucleus | ||||||
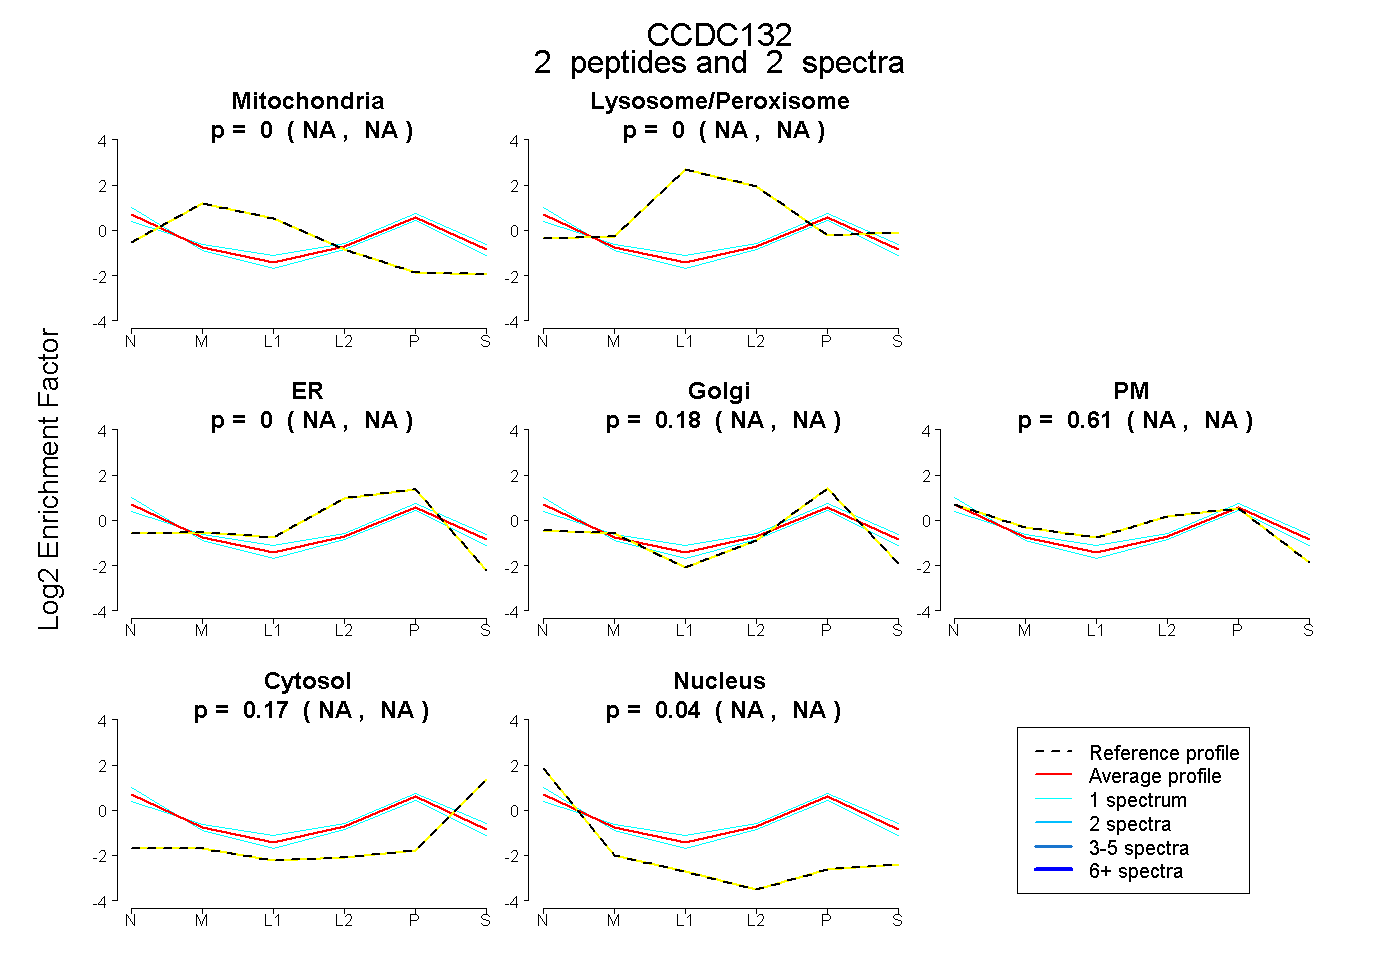
| Expt B |
2 peptides |
2 spectra |
|
0.000 NA | NA |
0.000 NA | NA |
0.000 NA | NA |
0.178 NA | NA |
0.615 NA | NA |
0.167 NA | NA |
0.040 NA | NA |
| 1 spectrum, QLLIGLLK | 0.000 | 0.000 | 0.000 | 0.209 | 0.551 | 0.097 | 0.143 | |||
| 1 spectrum, VADLILEK | 0.000 | 0.052 | 0.000 | 0.226 | 0.533 | 0.189 | 0.000 |
| Plot | Lyso | Other | |||||||||||
| Expt C |
2 peptides |
3 spectra |
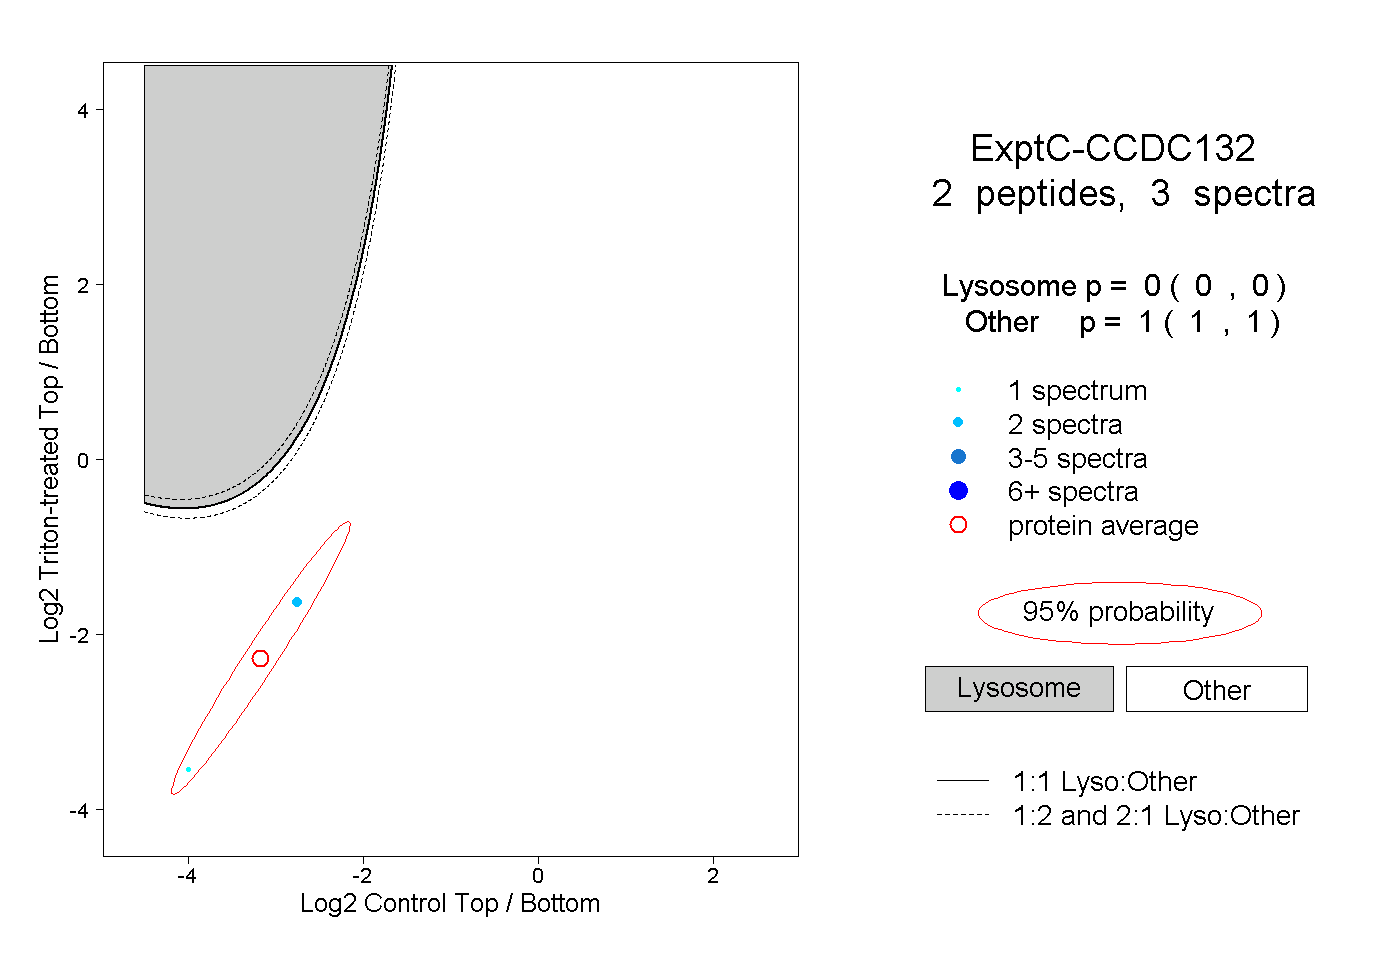 |
0.000 0.000 | 0.000 |
1.000 1.000 | 1.000 |