 15
15peptides
spectra
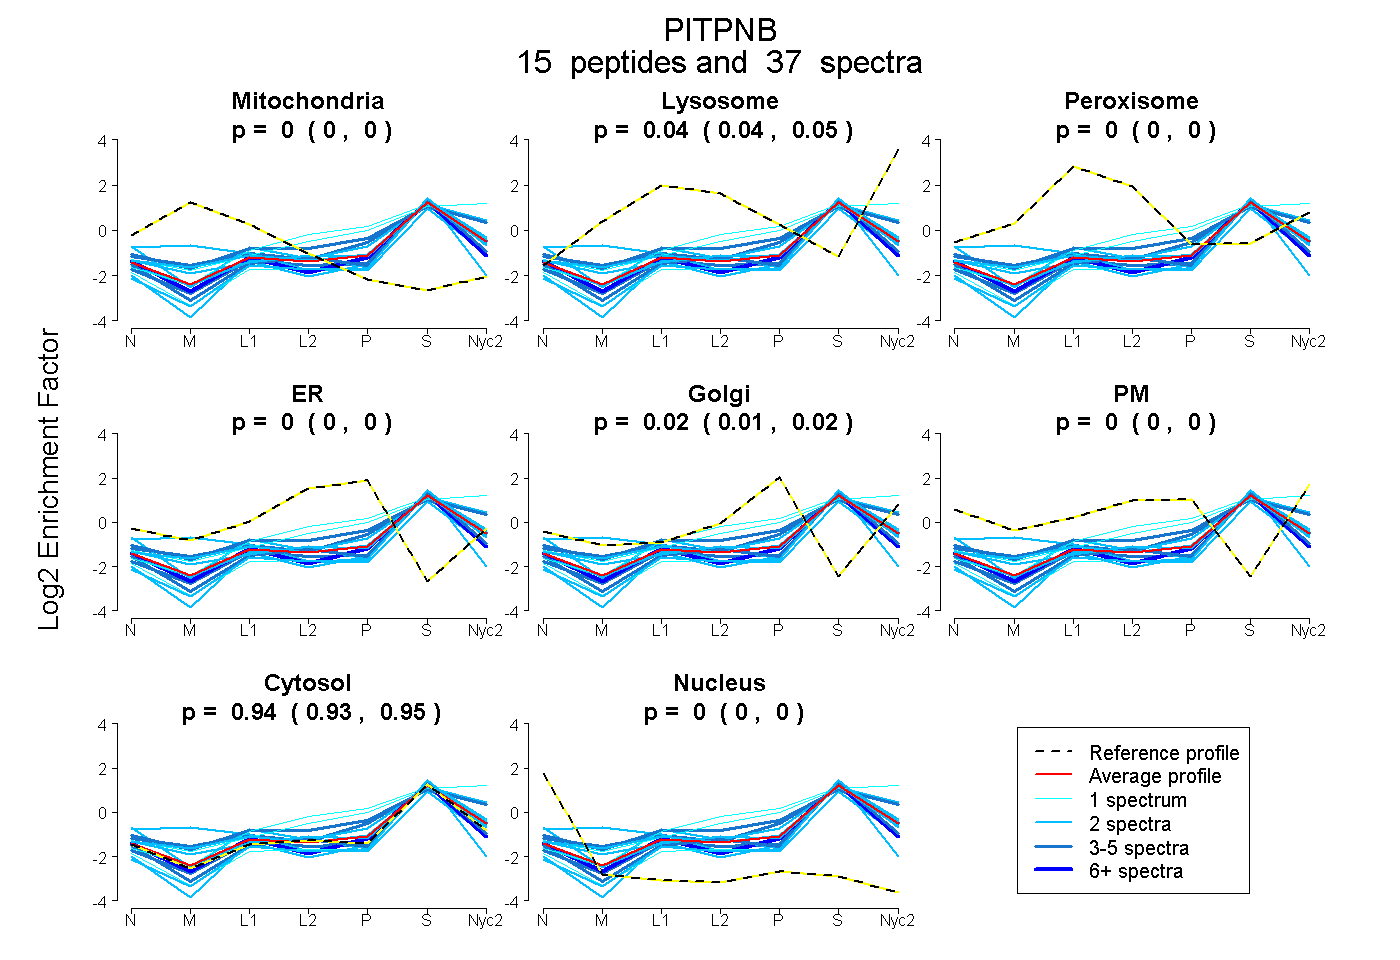
0.000 | 0.000
0.036 | 0.052
0.000 | 0.000
0.000 | 0.000
0.006 | 0.023
0.000 | 0.000
0.933 | 0.946
0.000 | 0.000
2peptides
spectra
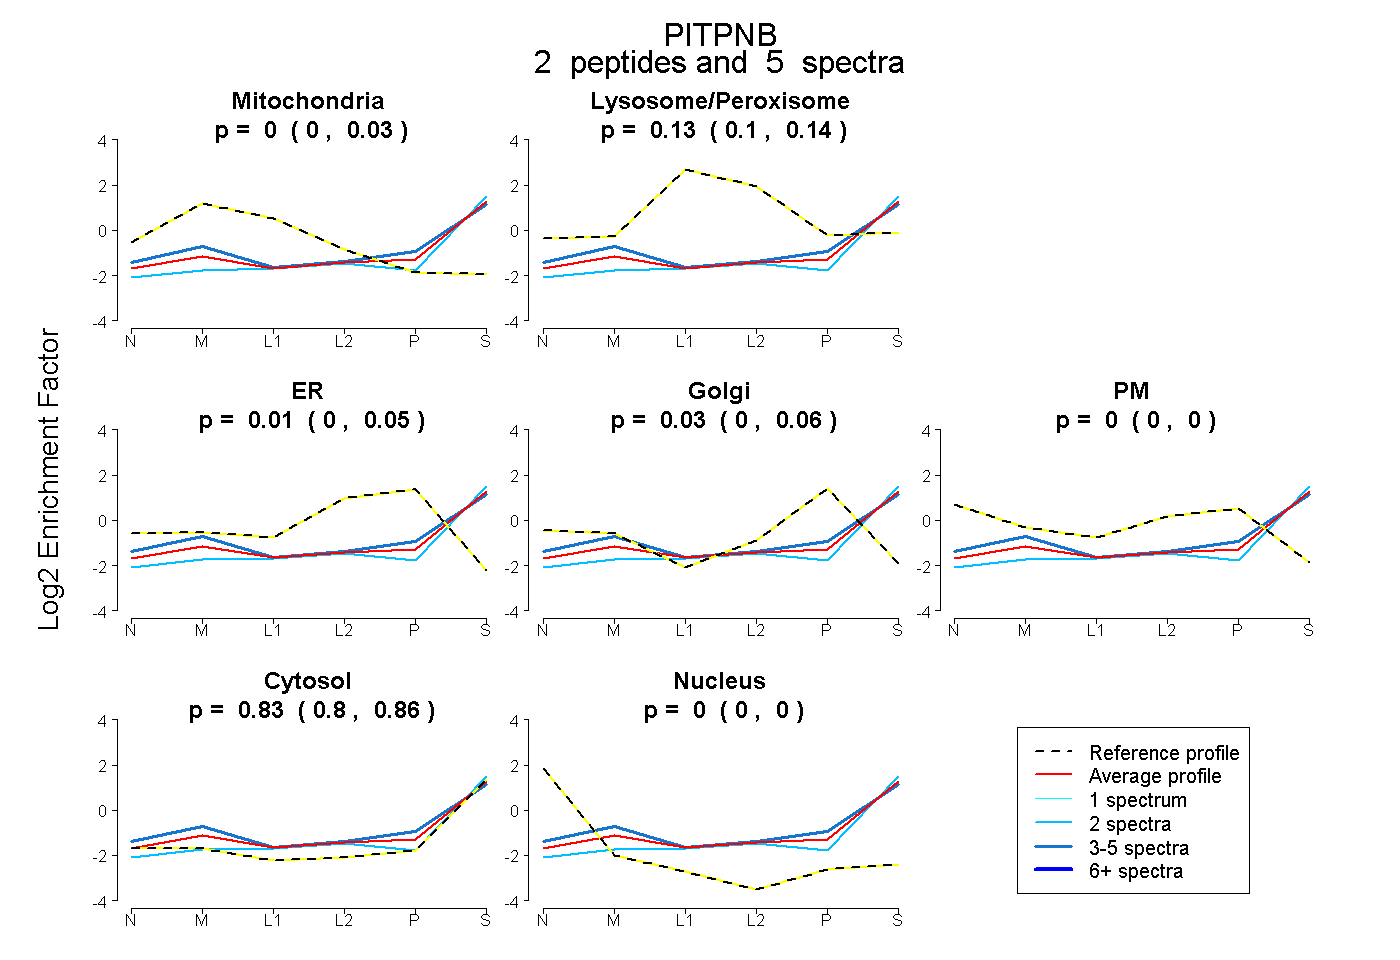
0.000 | 0.032
0.101 | 0.143
0.000 | 0.049
0.000 | 0.060
0.000 | 0.000
0.799 | 0.857
0.000 | 0.000
15peptides
spectra
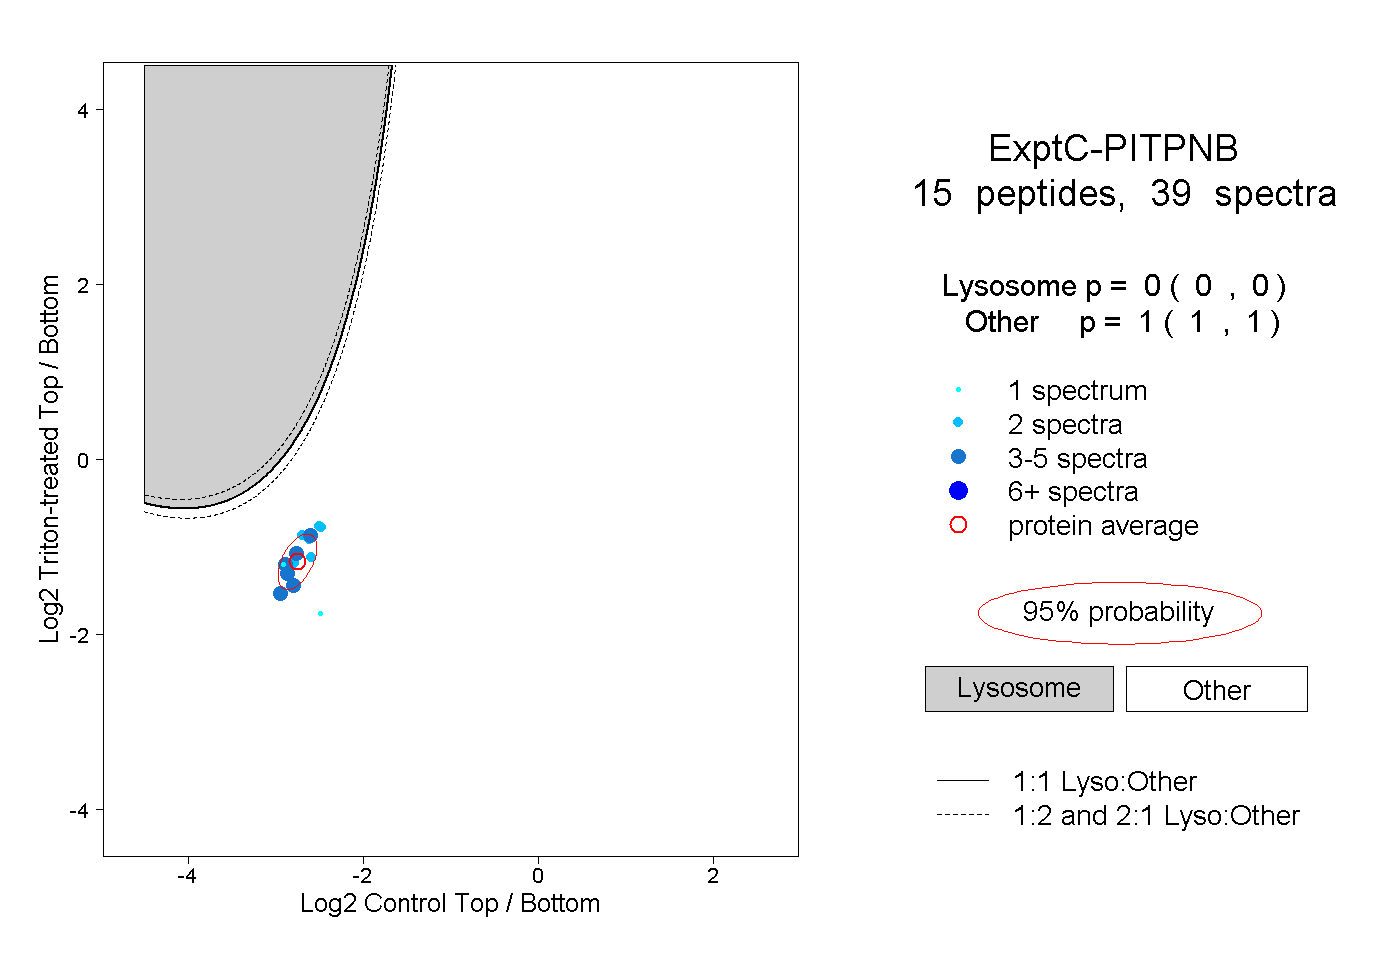
0.000 | 0.000
1.000 | 1.000
1peptide
spectrum
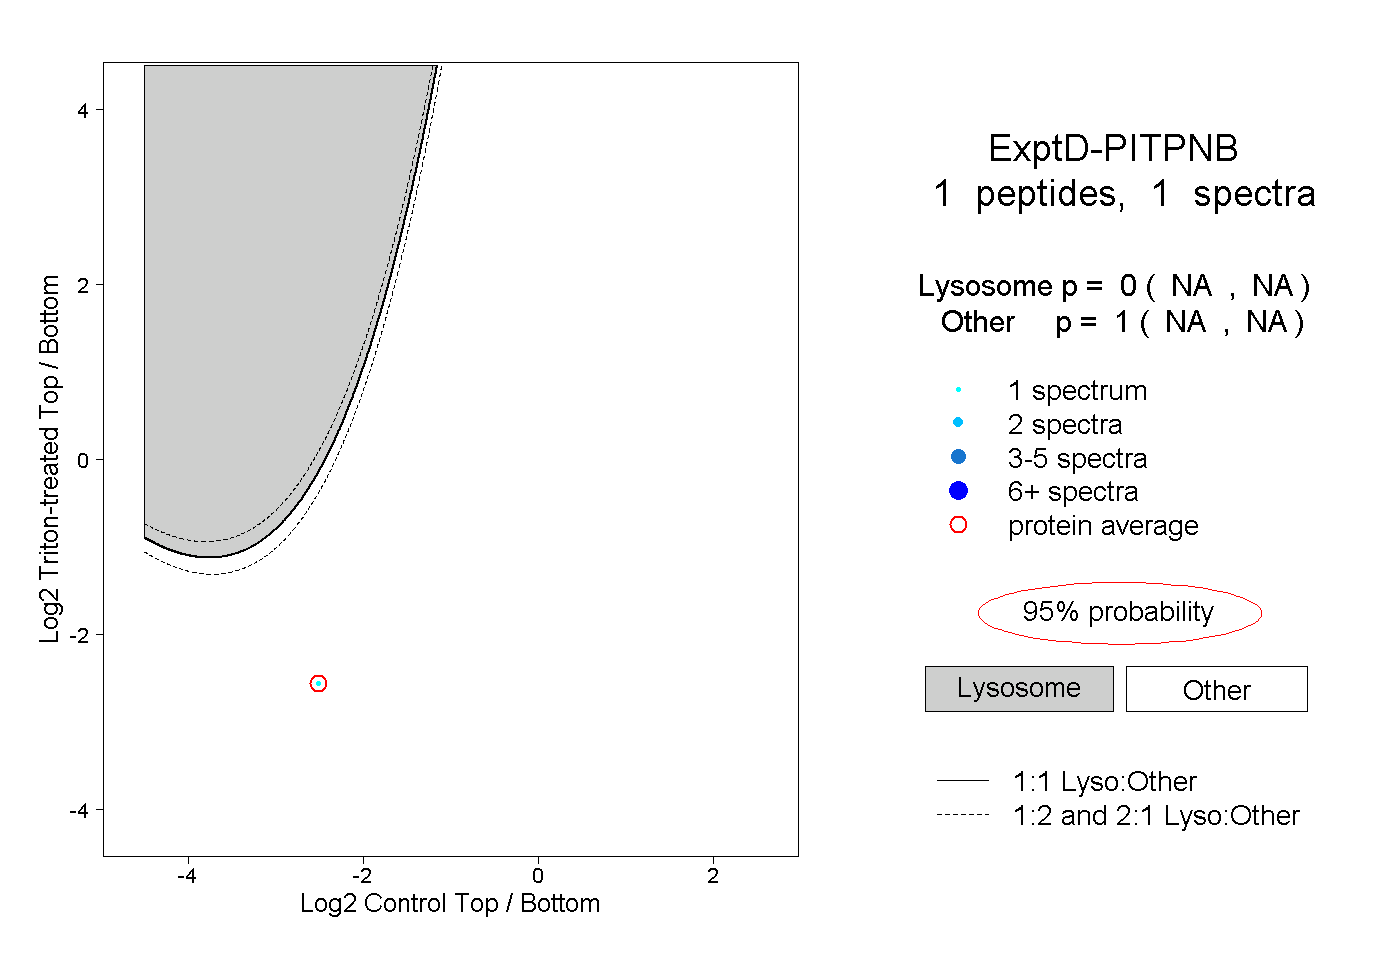
NA | NA
NA | NA