 15
15peptides
spectra
0.000 | 0.000
0.036 | 0.052
0.000 | 0.000
0.000 | 0.000
0.006 | 0.023
0.000 | 0.000
0.933 | 0.946
0.000 | 0.000
| Plot | Mito | Lyso | Perox | ER | Golgi | PM | Cytosol | Nucleus | |||||
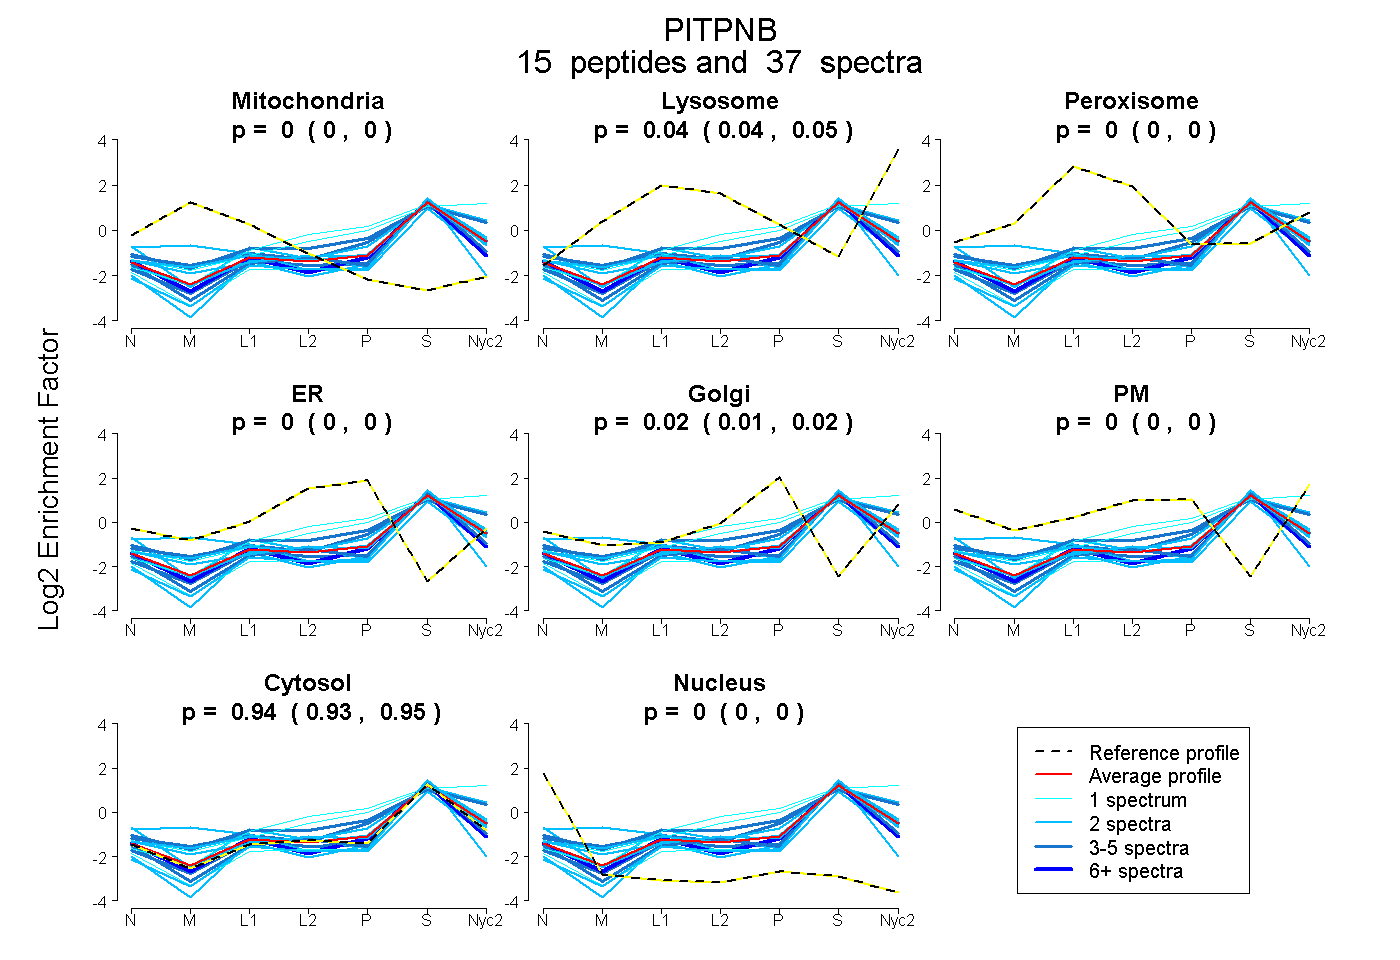
| Expt A |
15 peptides |
37 spectra |
|
0.000 0.000 | 0.000 |
0.044 0.036 | 0.052 |
0.000 0.000 | 0.000 |
0.000 0.000 | 0.000 |
0.016 0.006 | 0.023 |
0.000 0.000 | 0.000 |
0.940 0.933 | 0.946 |
0.000 0.000 | 0.000 |
| 3 spectra, MIAPEGSLVFHEK | 0.000 | 0.186 | 0.000 | 0.000 | 0.090 | 0.000 | 0.724 | 0.000 | ||
| 4 spectra, DDFFIK | 0.000 | 0.002 | 0.000 | 0.000 | 0.000 | 0.000 | 0.998 | 0.000 | ||
| 2 spectra, AWNAYPYCR | 0.000 | 0.000 | 0.000 | 0.000 | 0.000 | 0.000 | 0.941 | 0.059 | ||
| 2 spectra, WIDLTMEDIR | 0.000 | 0.000 | 0.000 | 0.000 | 0.000 | 0.000 | 1.000 | 0.000 | ||
| 7 spectra, IFTNLHR | 0.000 | 0.000 | 0.000 | 0.000 | 0.000 | 0.000 | 0.972 | 0.028 | ||
| 2 spectra, GQYTHK | 0.282 | 0.000 | 0.000 | 0.000 | 0.000 | 0.000 | 0.718 | 0.000 | ||
| 2 spectra, VPAFVR | 0.048 | 0.092 | 0.000 | 0.000 | 0.000 | 0.000 | 0.860 | 0.000 | ||
| 1 spectrum, NEPYENDGEK | 0.000 | 0.000 | 0.000 | 0.000 | 0.000 | 0.000 | 1.000 | 0.000 | ||
| 1 spectrum, TIVTNEYMK | 0.000 | 0.076 | 0.000 | 0.174 | 0.000 | 0.000 | 0.750 | 0.000 | ||
| 3 spectra, QLFCWLDK | 0.000 | 0.000 | 0.000 | 0.000 | 0.000 | 0.000 | 1.000 | 0.000 | ||
| 2 spectra, TVEIVHIDIADR | 0.032 | 0.048 | 0.000 | 0.000 | 0.013 | 0.000 | 0.908 | 0.000 | ||
| 1 spectrum, VENFIQK | 0.000 | 0.248 | 0.000 | 0.000 | 0.103 | 0.000 | 0.649 | 0.000 | ||
| 2 spectra, NETGGGEGIEVLK | 0.000 | 0.043 | 0.000 | 0.000 | 0.000 | 0.000 | 0.957 | 0.000 | ||
| 3 spectra, ADEDPALFQSVK | 0.020 | 0.054 | 0.016 | 0.000 | 0.113 | 0.000 | 0.797 | 0.000 | ||
| 2 spectra, GPLGPNWK | 0.000 | 0.097 | 0.000 | 0.000 | 0.000 | 0.091 | 0.812 | 0.000 |
| Plot | Mito | Lyso or Perox | ER | Golgi | PM | Cytosol | Nucleus | ||||||
| Expt B |
2 peptides |
5 spectra |
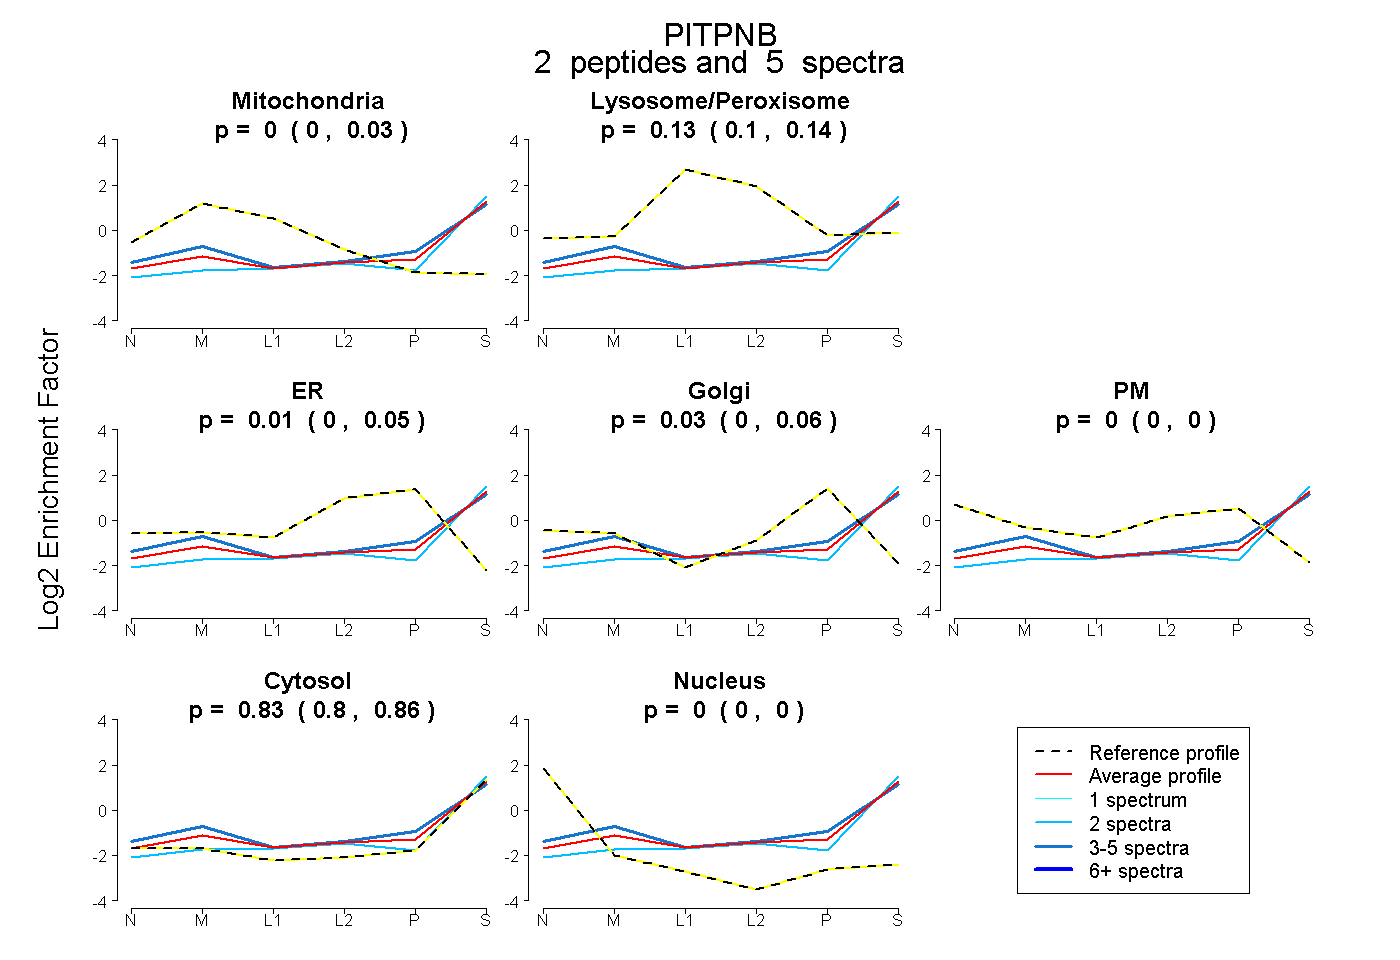 |
0.000 0.000 | 0.032 |
0.130 0.101 | 0.143 |
0.011 0.000 | 0.049 |
0.026 0.000 | 0.060 |
0.000 0.000 | 0.000 |
0.834 0.799 | 0.857 |
0.000 0.000 | 0.000 |
|||
| Plot | Lyso | Other | |||||||||||
| Expt C |
15 peptides |
39 spectra |
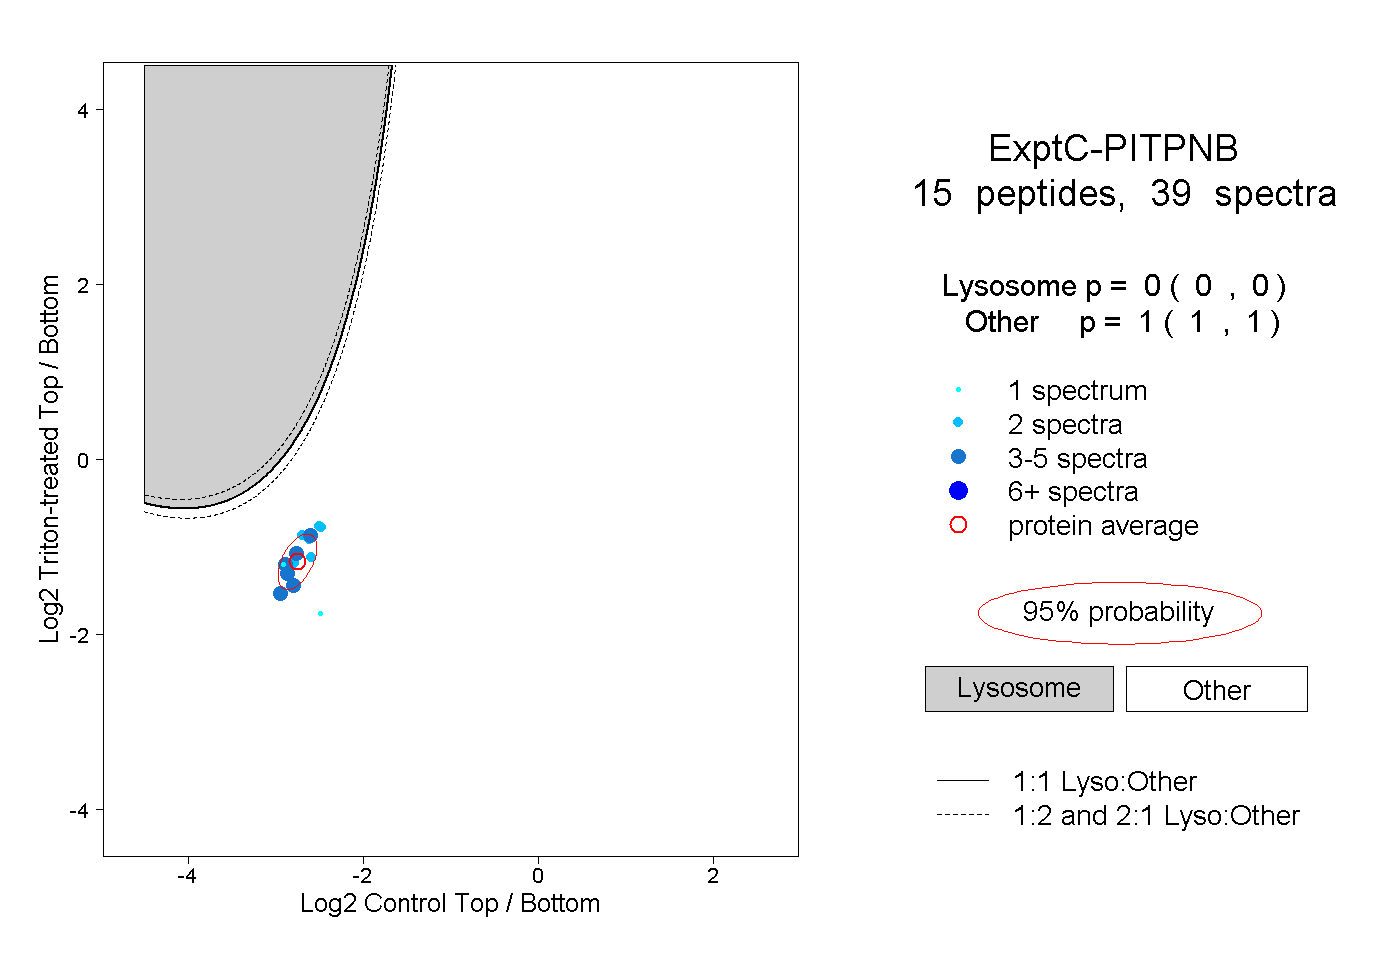 |
0.000 0.000 | 0.000 |
1.000 1.000 | 1.000 |
||||||||
| Plot | Lyso | Other | |||||||||||
| Expt D |
1 peptide |
1 spectrum |
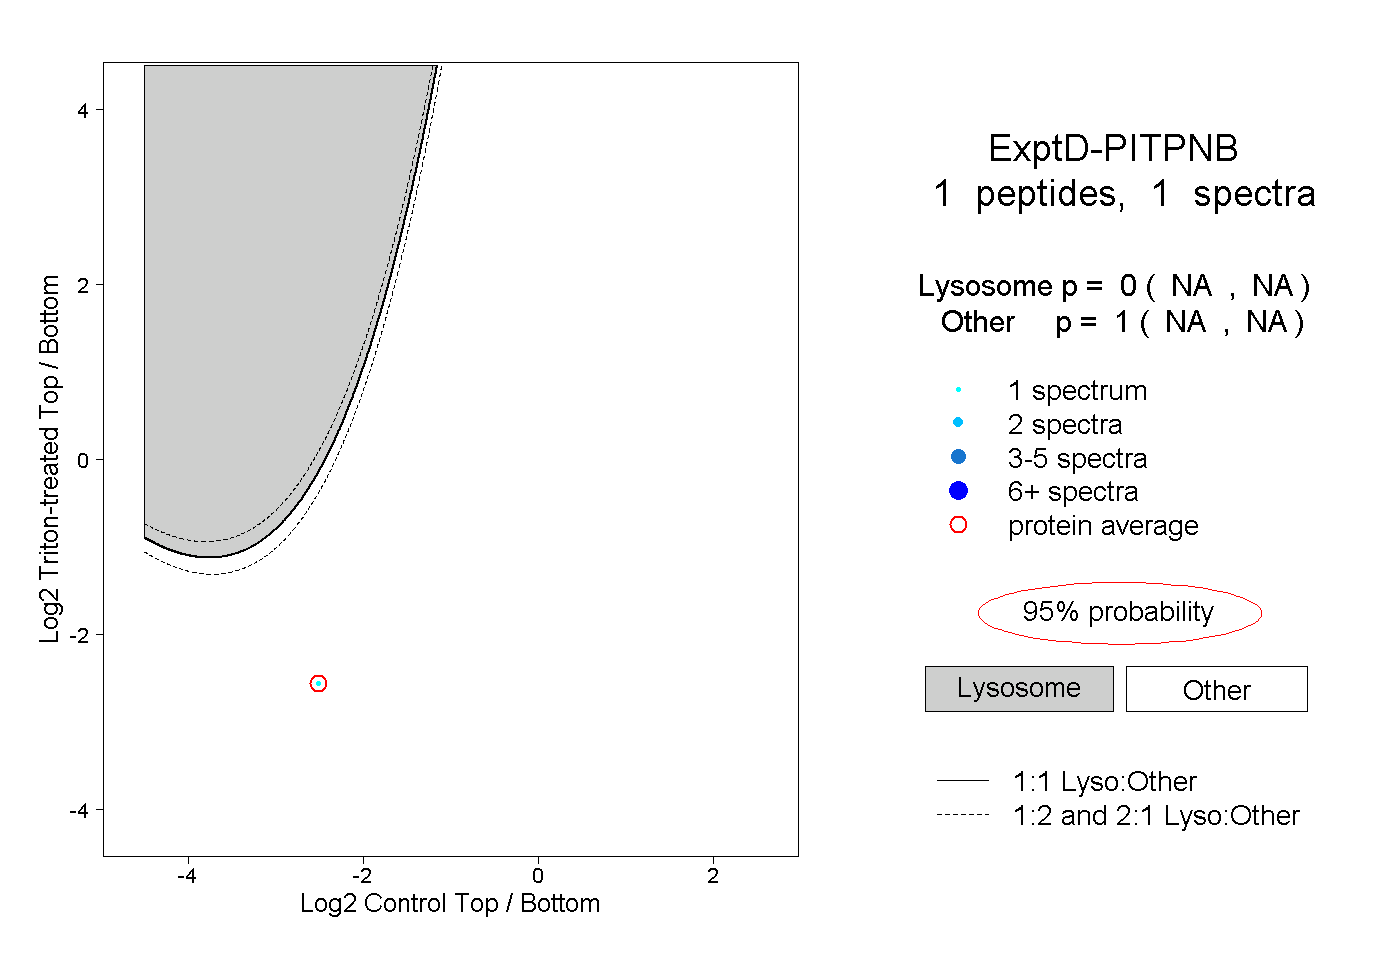 |
0.000 NA | NA |
1.000 NA | NA |