 8
8peptides
spectra
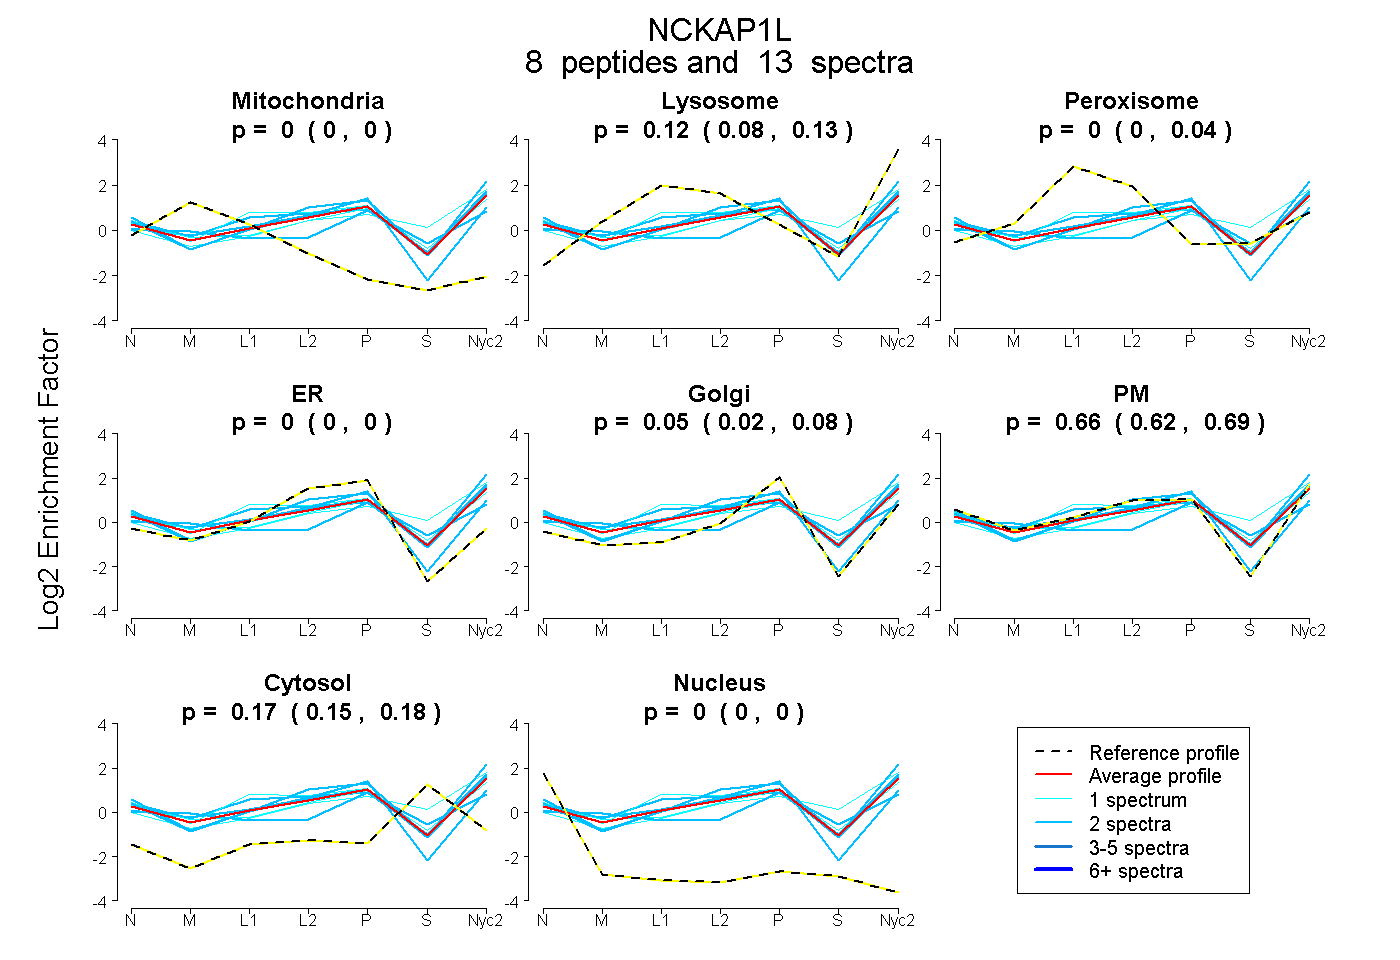
0.000 | 0.000
0.084 | 0.132
0.000 | 0.037
0.000 | 0.000
0.022 | 0.082
0.619 | 0.686
0.150 | 0.180
0.000 | 0.000
8peptides
spectra
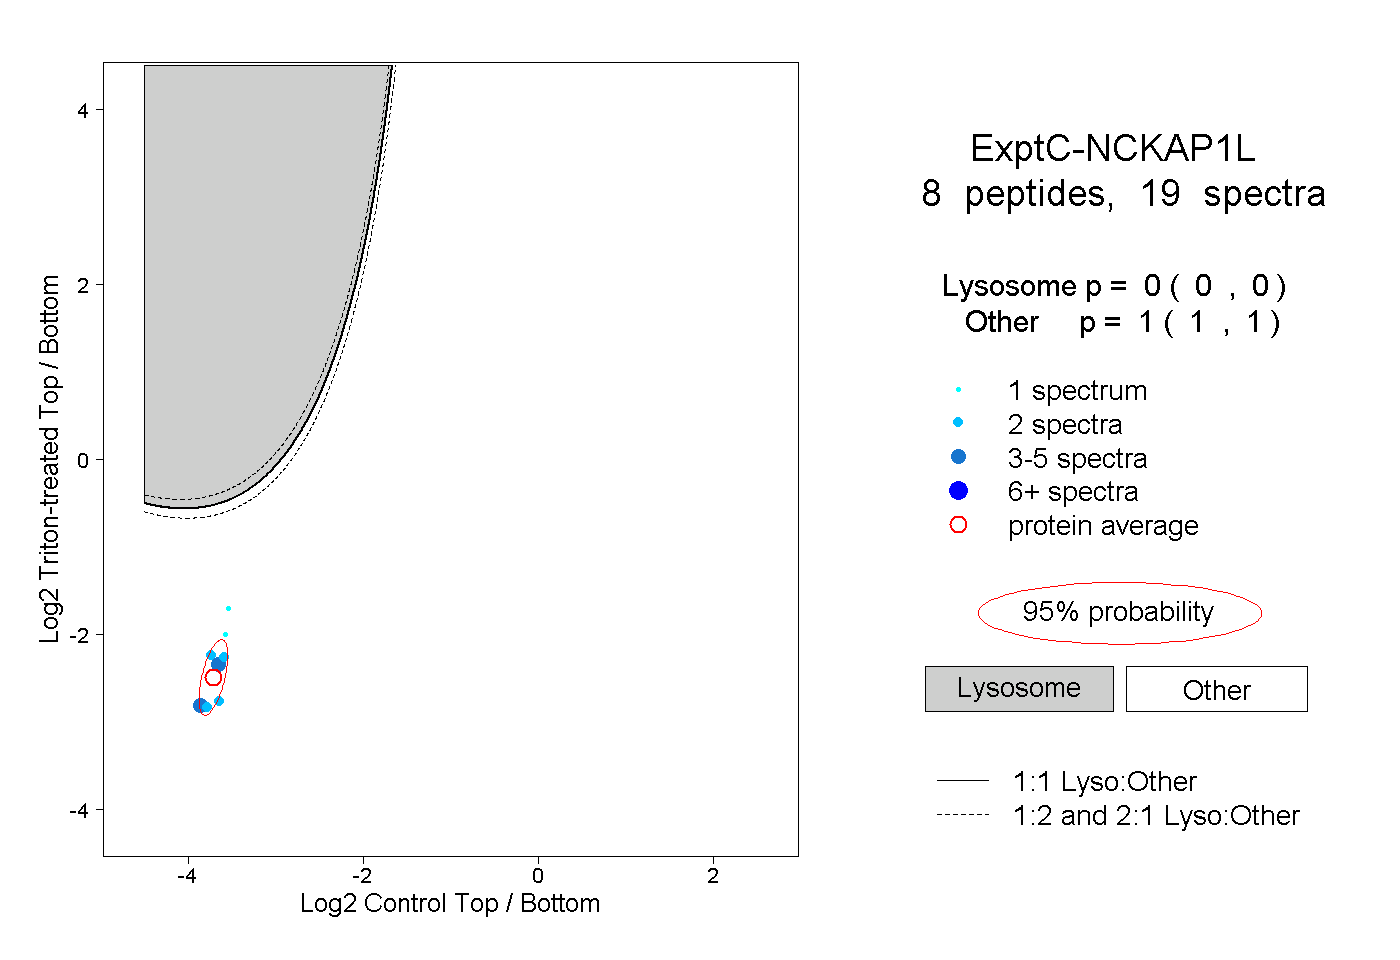
0.000 | 0.000
1.000 | 1.000
2peptides
spectra
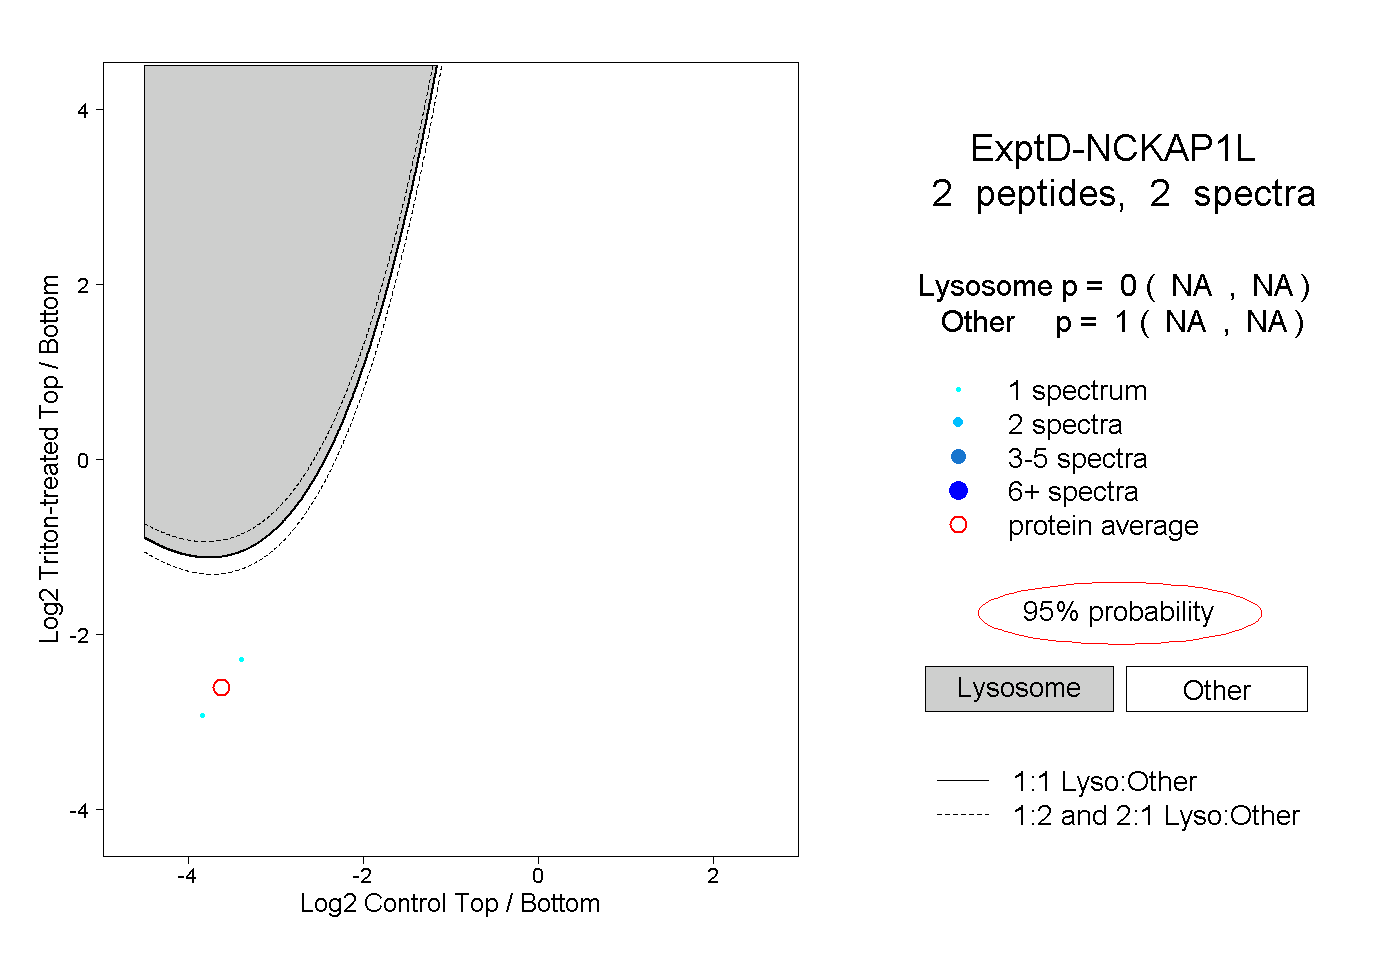
NA | NA
NA | NA