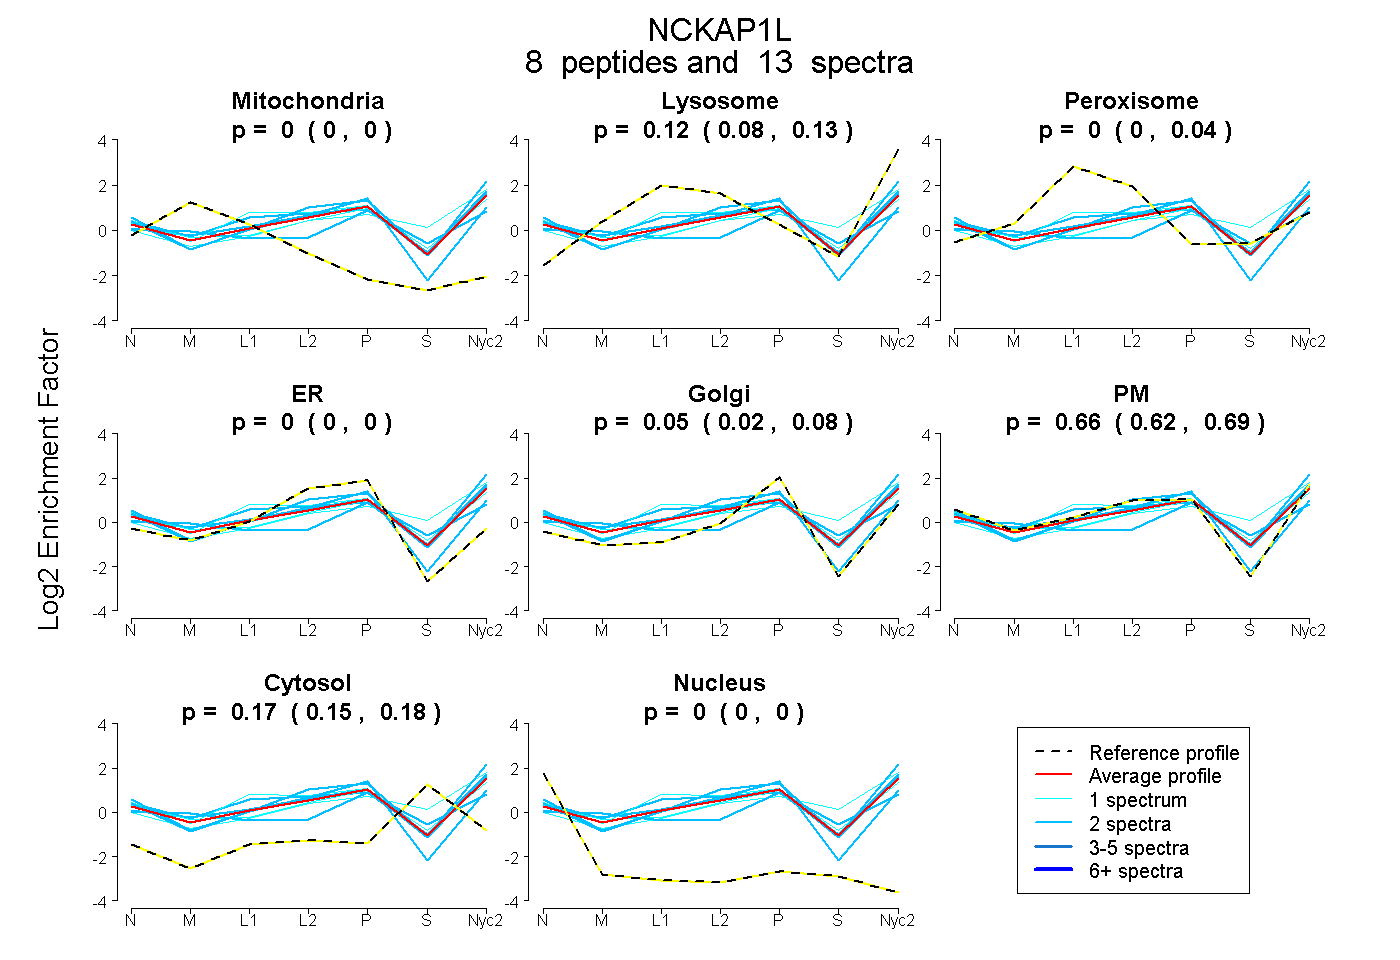
 8
8peptides
spectra
0.000 | 0.000
0.084 | 0.132
0.000 | 0.037
0.000 | 0.000
0.022 | 0.082
0.619 | 0.686
0.150 | 0.180
0.000 | 0.000
| Plot | Mito | Lyso | Perox | ER | Golgi | PM | Cytosol | Nucleus | |||||
| Expt A |
8 peptides |
13 spectra |
|
0.000 0.000 | 0.000 |
0.116 0.084 | 0.132 |
0.004 0.000 | 0.037 |
0.000 0.000 | 0.000 |
0.048 0.022 | 0.082 |
0.663 0.619 | 0.686 |
0.169 0.150 | 0.180 |
0.000 0.000 | 0.000 |
| 2 spectra, LTEEFGPHTK | 0.000 | 0.160 | 0.000 | 0.000 | 0.051 | 0.686 | 0.103 | 0.000 | ||
| 1 spectrum, FDFSGLR | 0.000 | 0.241 | 0.000 | 0.000 | 0.000 | 0.428 | 0.330 | 0.000 | ||
| 2 spectra, LTILNDR | 0.000 | 0.000 | 0.000 | 0.156 | 0.157 | 0.634 | 0.028 | 0.025 | ||
| 2 spectra, AFYLNR | 0.000 | 0.128 | 0.107 | 0.000 | 0.000 | 0.648 | 0.118 | 0.000 | ||
| 1 spectrum, DGYNNNIHCLTK | 0.000 | 0.228 | 0.035 | 0.000 | 0.000 | 0.649 | 0.087 | 0.000 | ||
| 2 spectra, VIQQYHLQYLAR | 0.054 | 0.083 | 0.029 | 0.000 | 0.247 | 0.335 | 0.253 | 0.000 | ||
| 2 spectra, ALAEILGPYGMK | 0.000 | 0.174 | 0.024 | 0.000 | 0.107 | 0.563 | 0.132 | 0.000 | ||
| 1 spectrum, DKPGAESHR | 0.000 | 0.079 | 0.000 | 0.000 | 0.033 | 0.669 | 0.218 | 0.000 |
| Plot | Lyso | Other | |||||||||||
| Expt C |
8 peptides |
19 spectra |
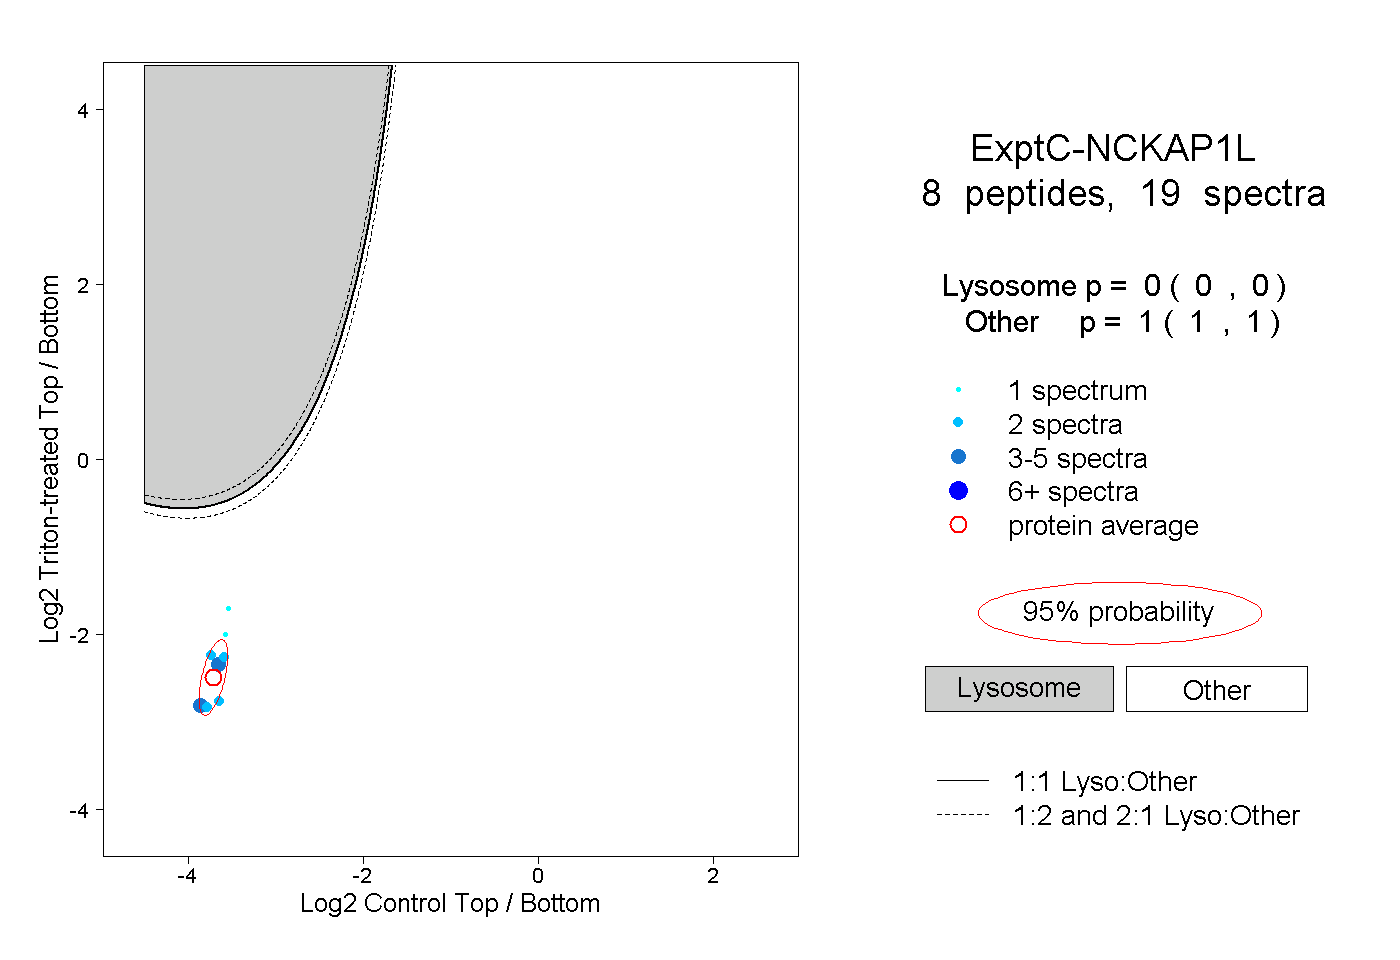 |
0.000 0.000 | 0.000 |
1.000 1.000 | 1.000 |
||||||||
| Plot | Lyso | Other | |||||||||||
| Expt D |
2 peptides |
2 spectra |
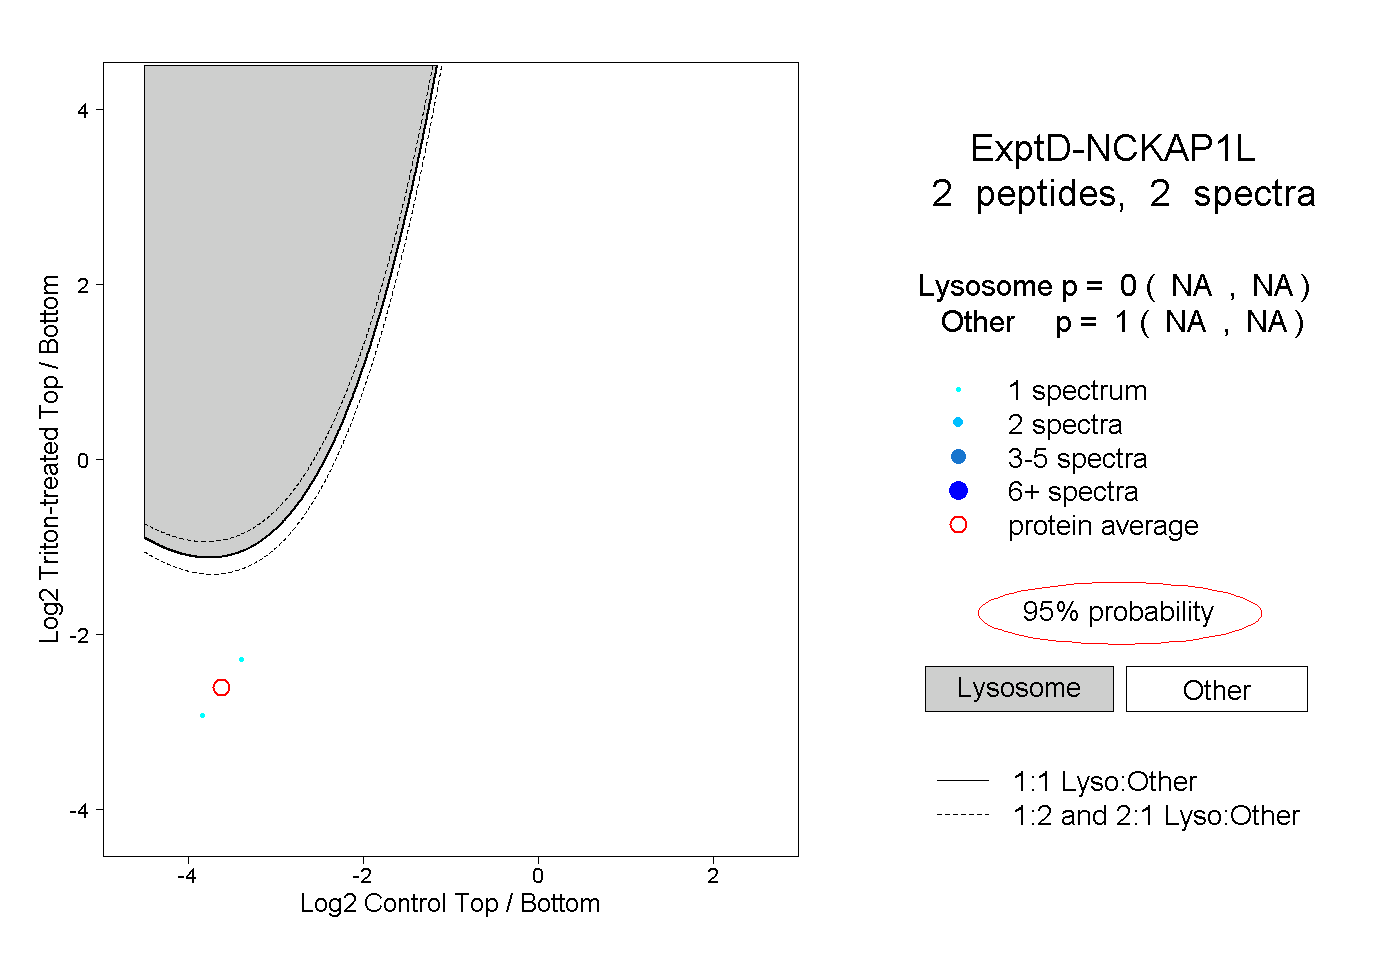 |
0.000 NA | NA |
1.000 NA | NA |