 3
3peptides
spectra
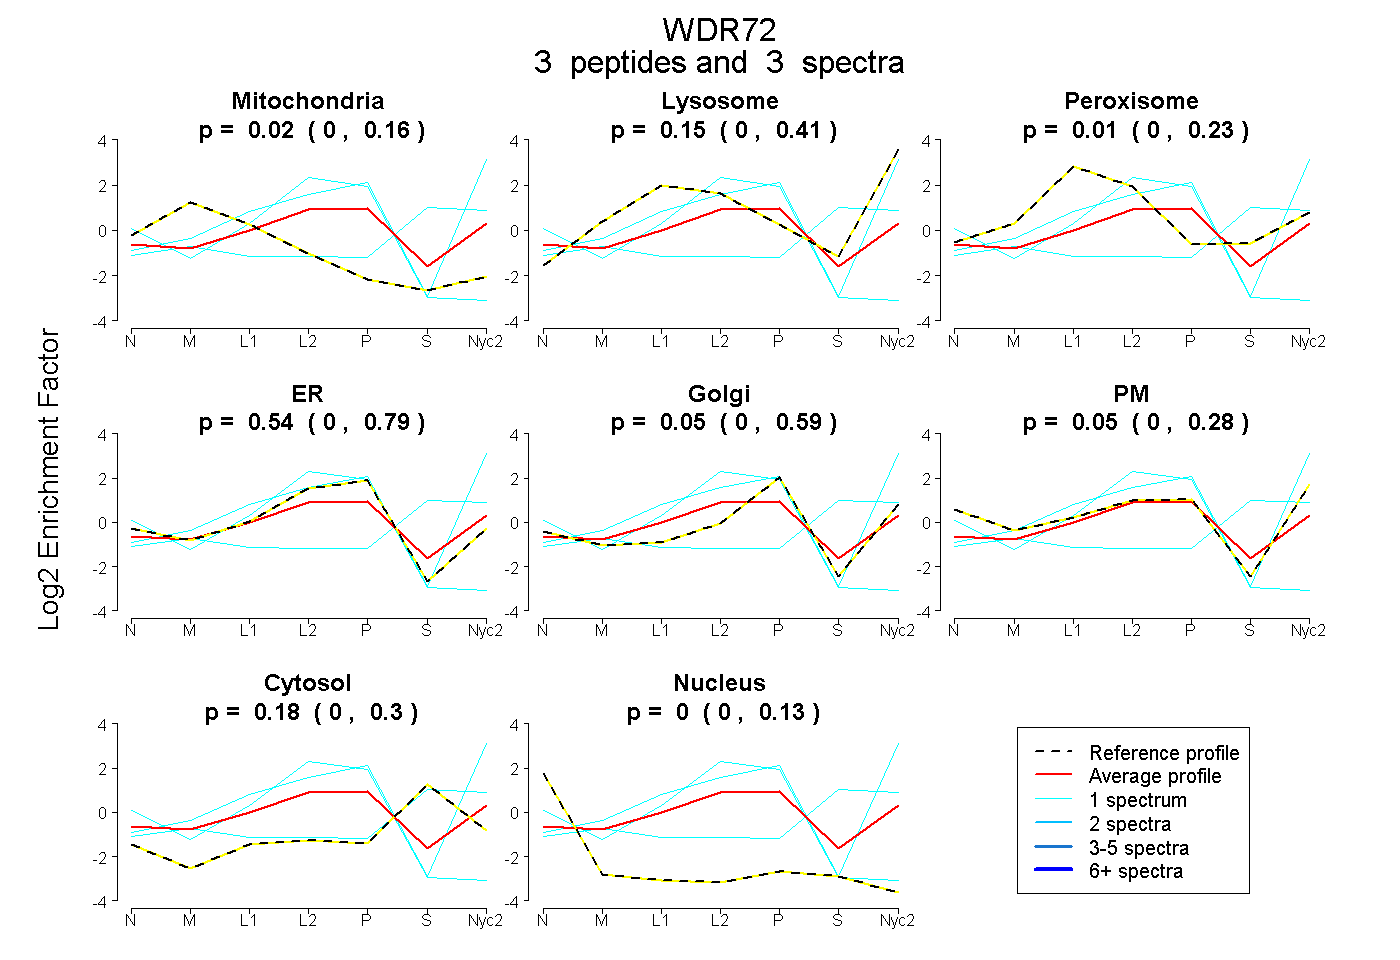
0.000 | 0.164
0.000 | 0.414
0.000 | 0.232
0.000 | 0.786
0.000 | 0.588
0.000 | 0.276
0.000 | 0.300
0.000 | 0.135
1peptide
spectrum
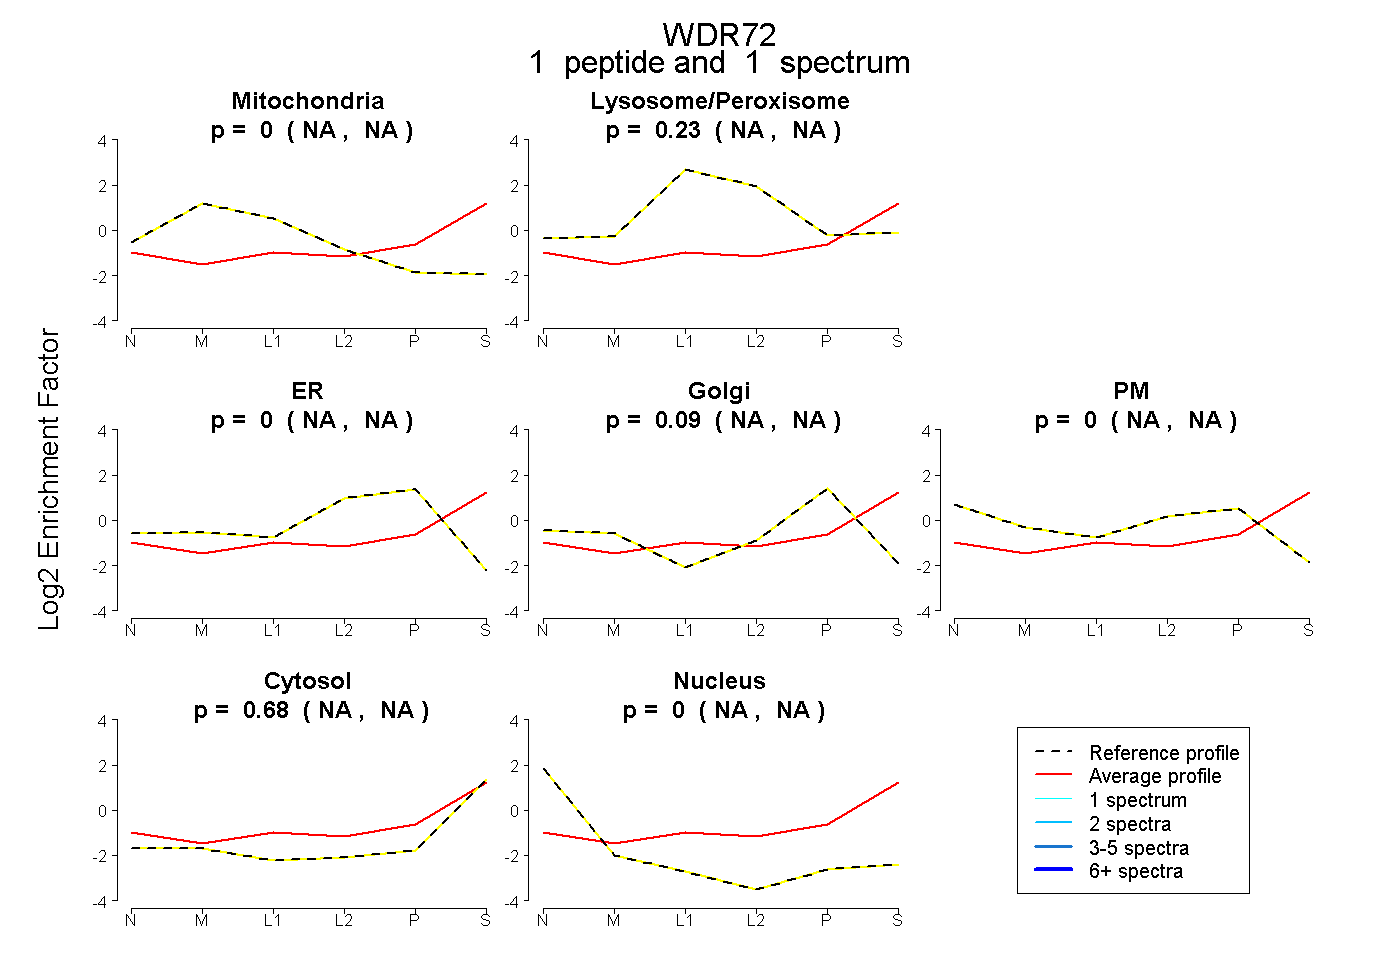
NA | NA
NA | NA
NA | NA
NA | NA
NA | NA
NA | NA
NA | NA
2peptides
spectra
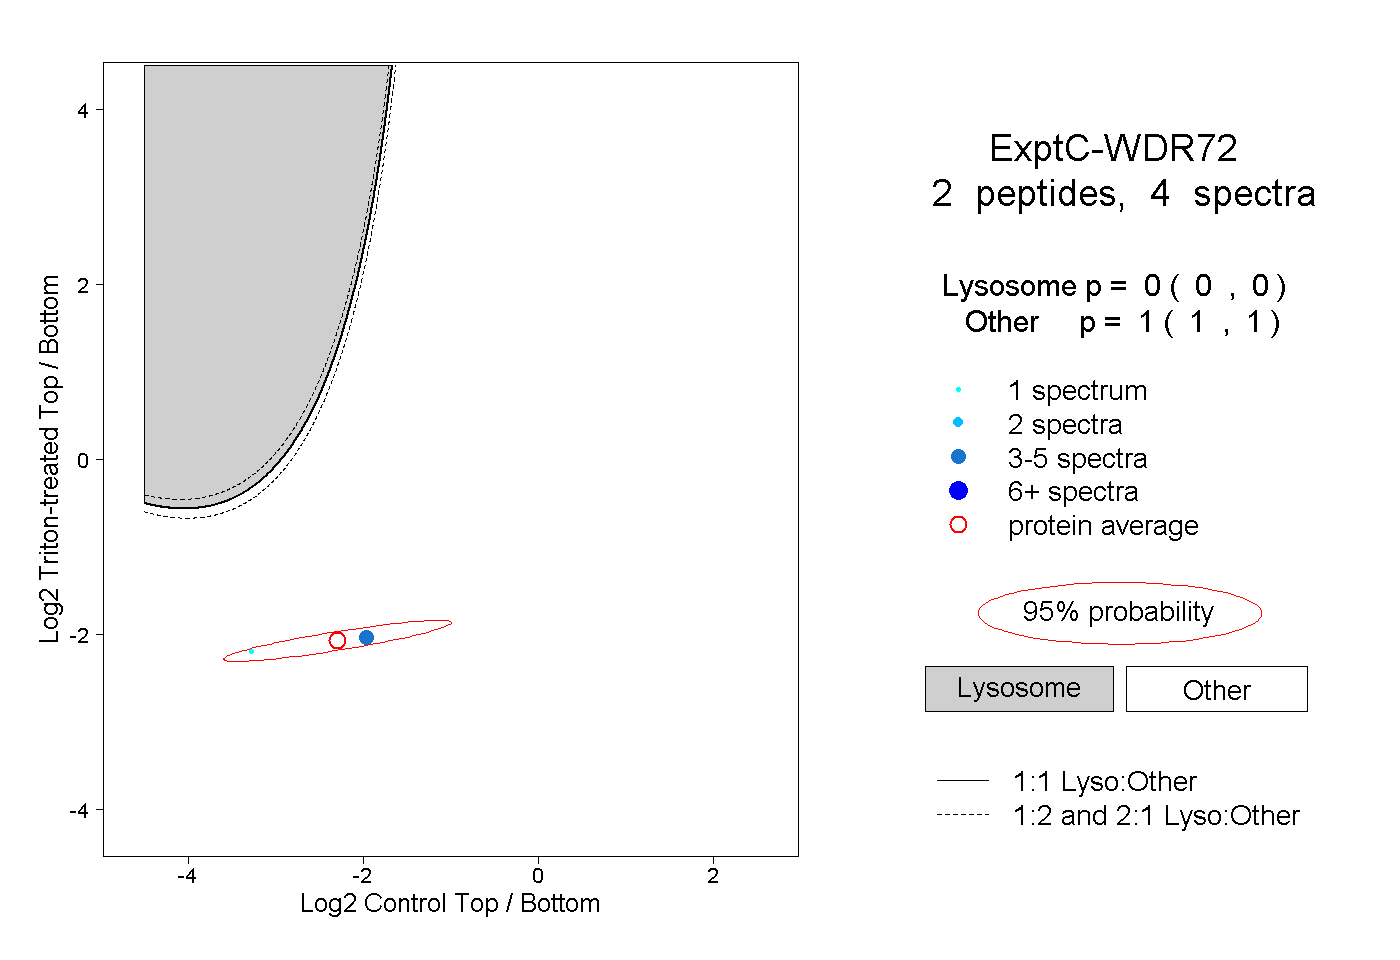
0.000 | 0.000
1.000 | 1.000