 3
3peptides
spectra
0.000 | 0.164
0.000 | 0.414
0.000 | 0.232
0.000 | 0.786
0.000 | 0.588
0.000 | 0.276
0.000 | 0.300
0.000 | 0.135
| Plot | Mito | Lyso | Perox | ER | Golgi | PM | Cytosol | Nucleus | |||||
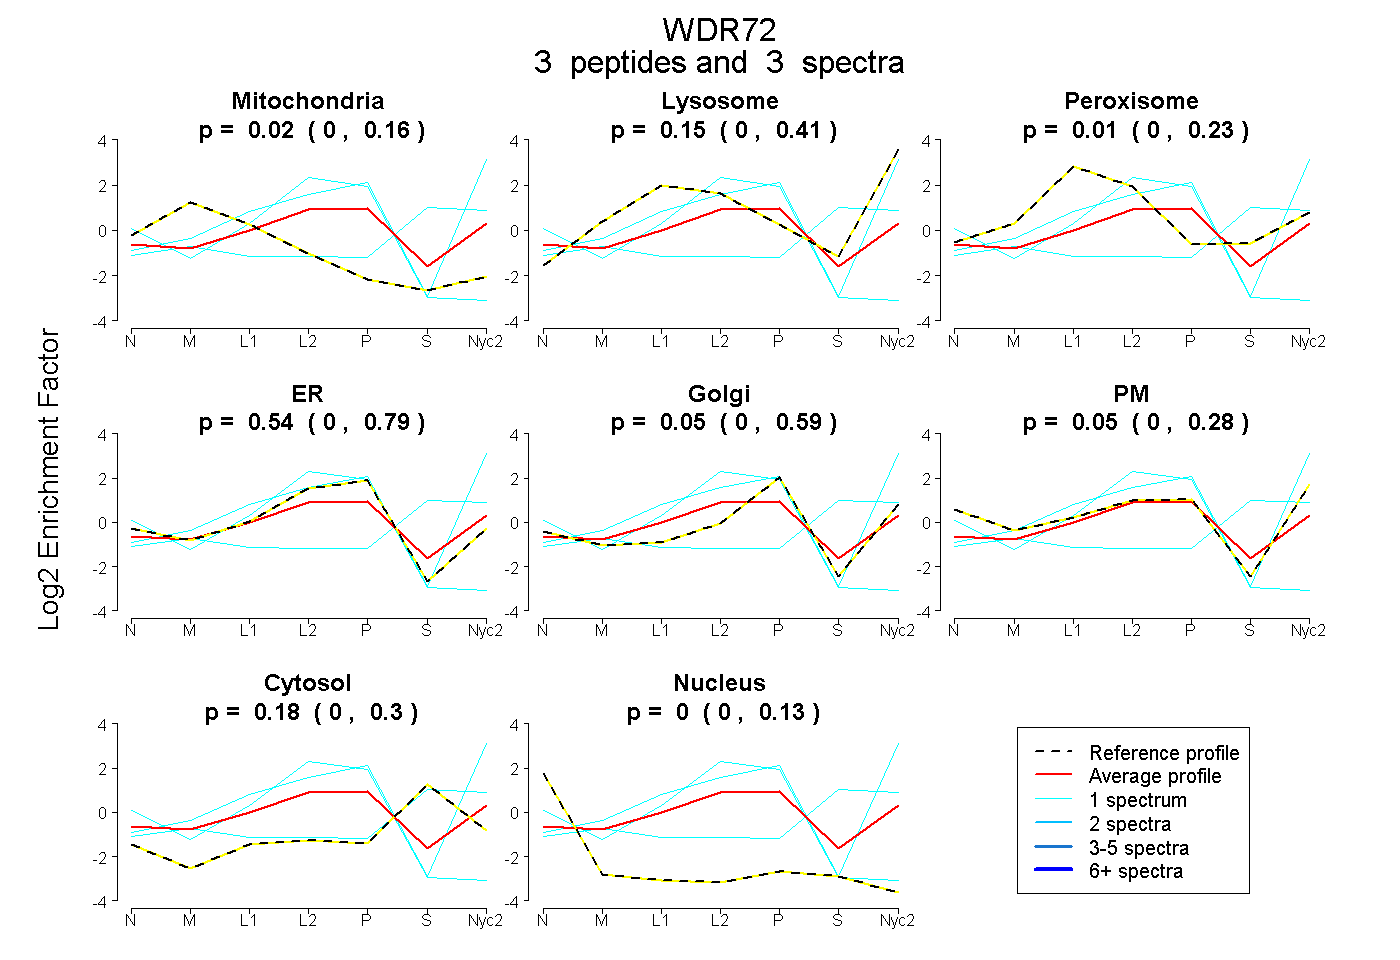
| Expt A |
3 peptides |
3 spectra |
|
0.023 0.000 | 0.164 |
0.150 0.000 | 0.414 |
0.006 0.000 | 0.232 |
0.541 0.000 | 0.786 |
0.053 0.000 | 0.588 |
0.045 0.000 | 0.276 |
0.182 0.000 | 0.300 |
0.000 0.000 | 0.135 |
| 1 spectrum, TLTIR | 0.000 | 0.473 | 0.000 | 0.046 | 0.254 | 0.227 | 0.000 | 0.000 | ||
| 1 spectrum, CMCPADGGVLK | 0.000 | 0.000 | 0.000 | 0.909 | 0.000 | 0.000 | 0.000 | 0.091 | ||
| 1 spectrum, ELRPFK | 0.039 | 0.252 | 0.000 | 0.000 | 0.000 | 0.000 | 0.709 | 0.000 |
| Plot | Mito | Lyso or Perox | ER | Golgi | PM | Cytosol | Nucleus | ||||||
| Expt B |
1 peptide |
1 spectrum |
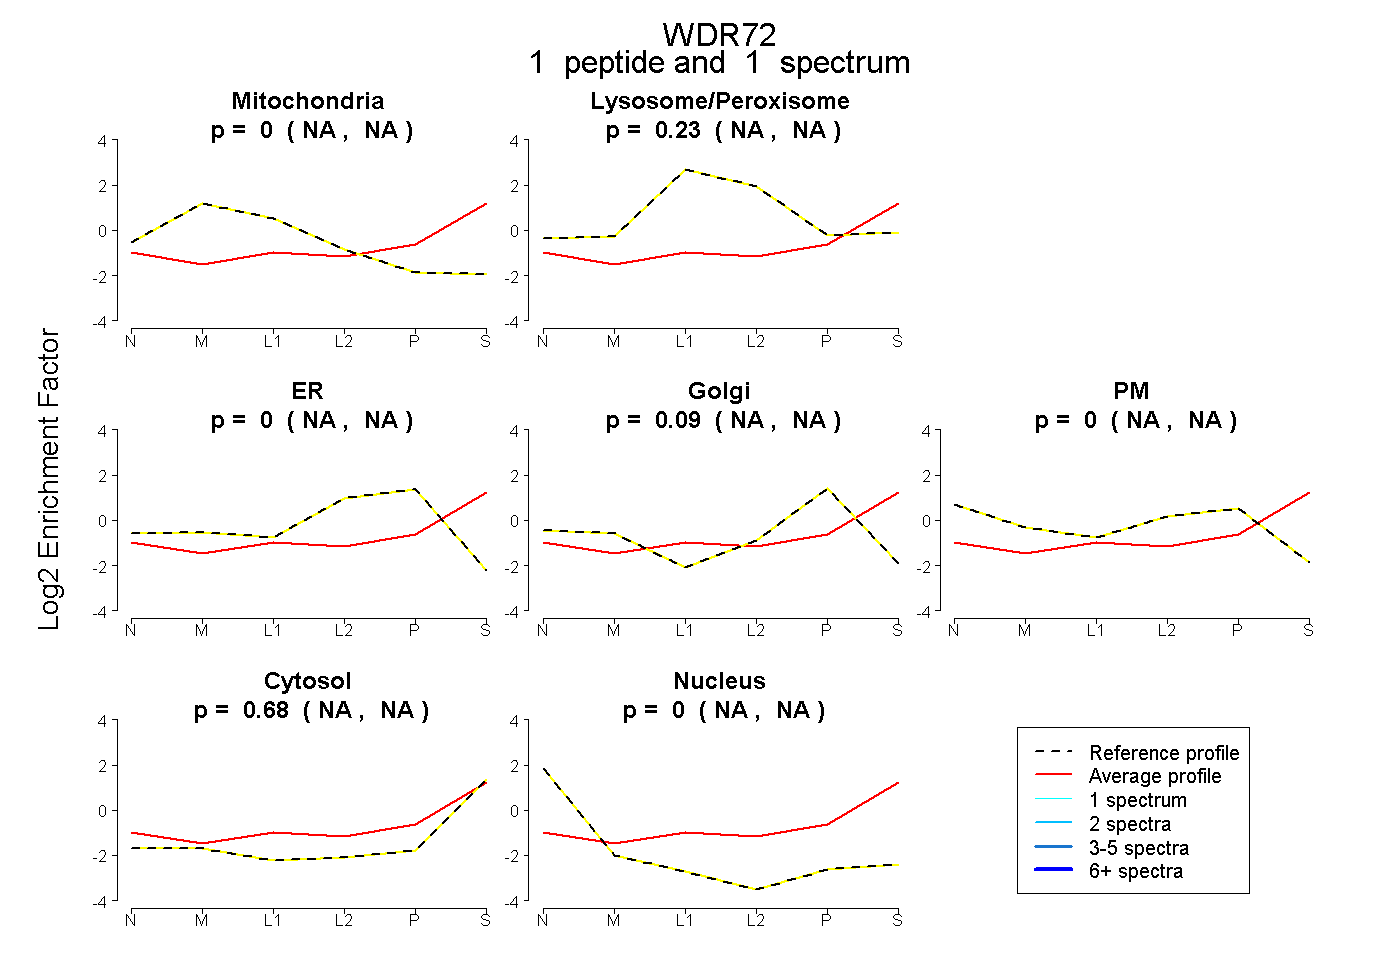 |
0.000 NA | NA |
0.232 NA | NA |
0.000 NA | NA |
0.089 NA | NA |
0.000 NA | NA |
0.679 NA | NA |
0.000 NA | NA |
|||
| Plot | Lyso | Other | |||||||||||
| Expt C |
2 peptides |
4 spectra |
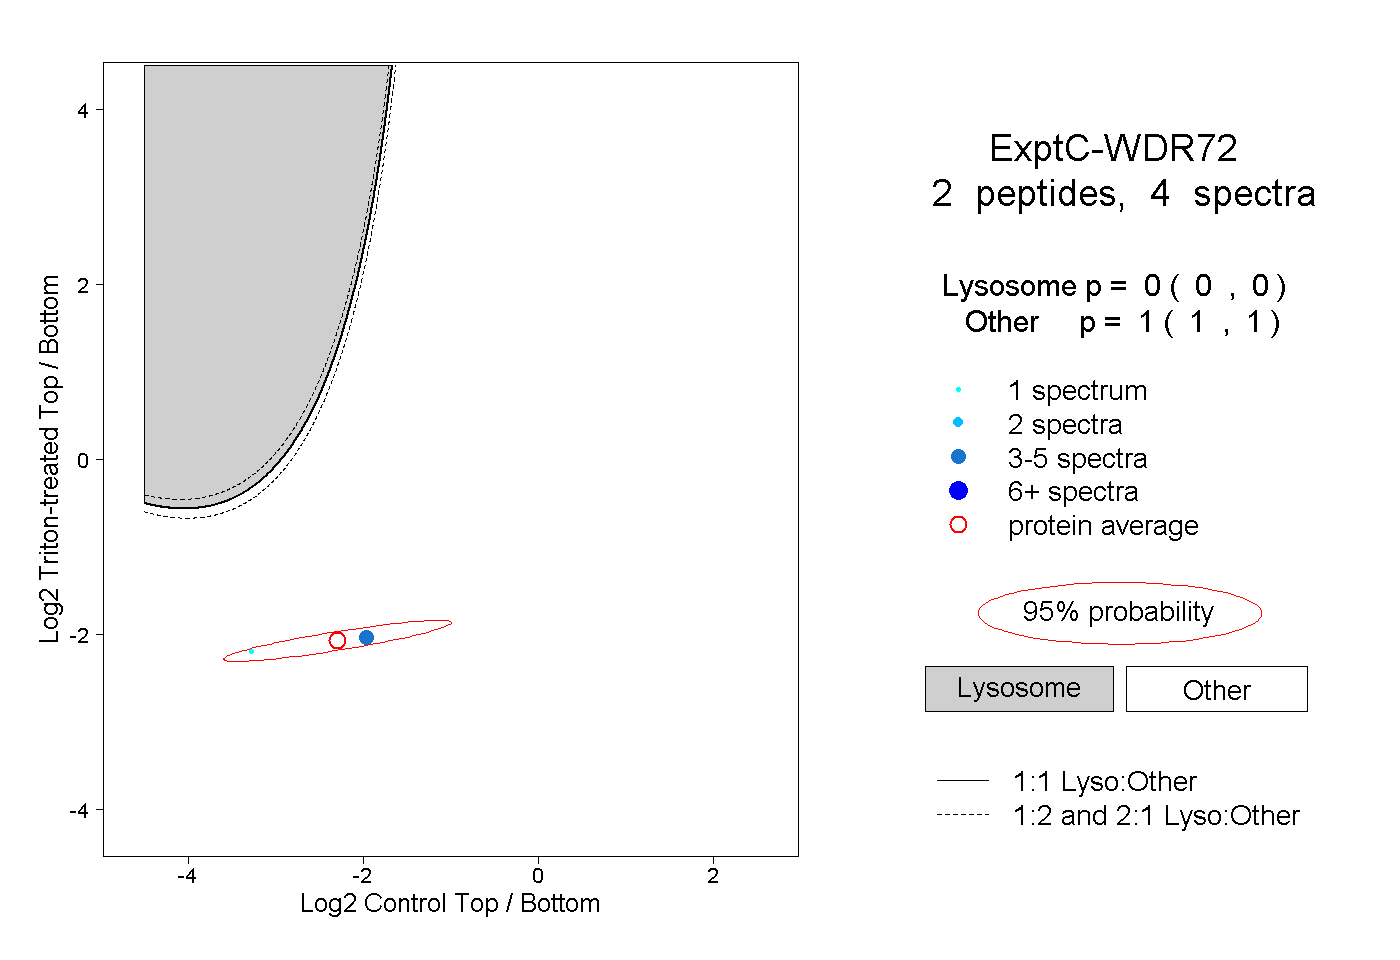 |
0.000 0.000 | 0.000 |
1.000 1.000 | 1.000 |