 26
26peptides
spectra
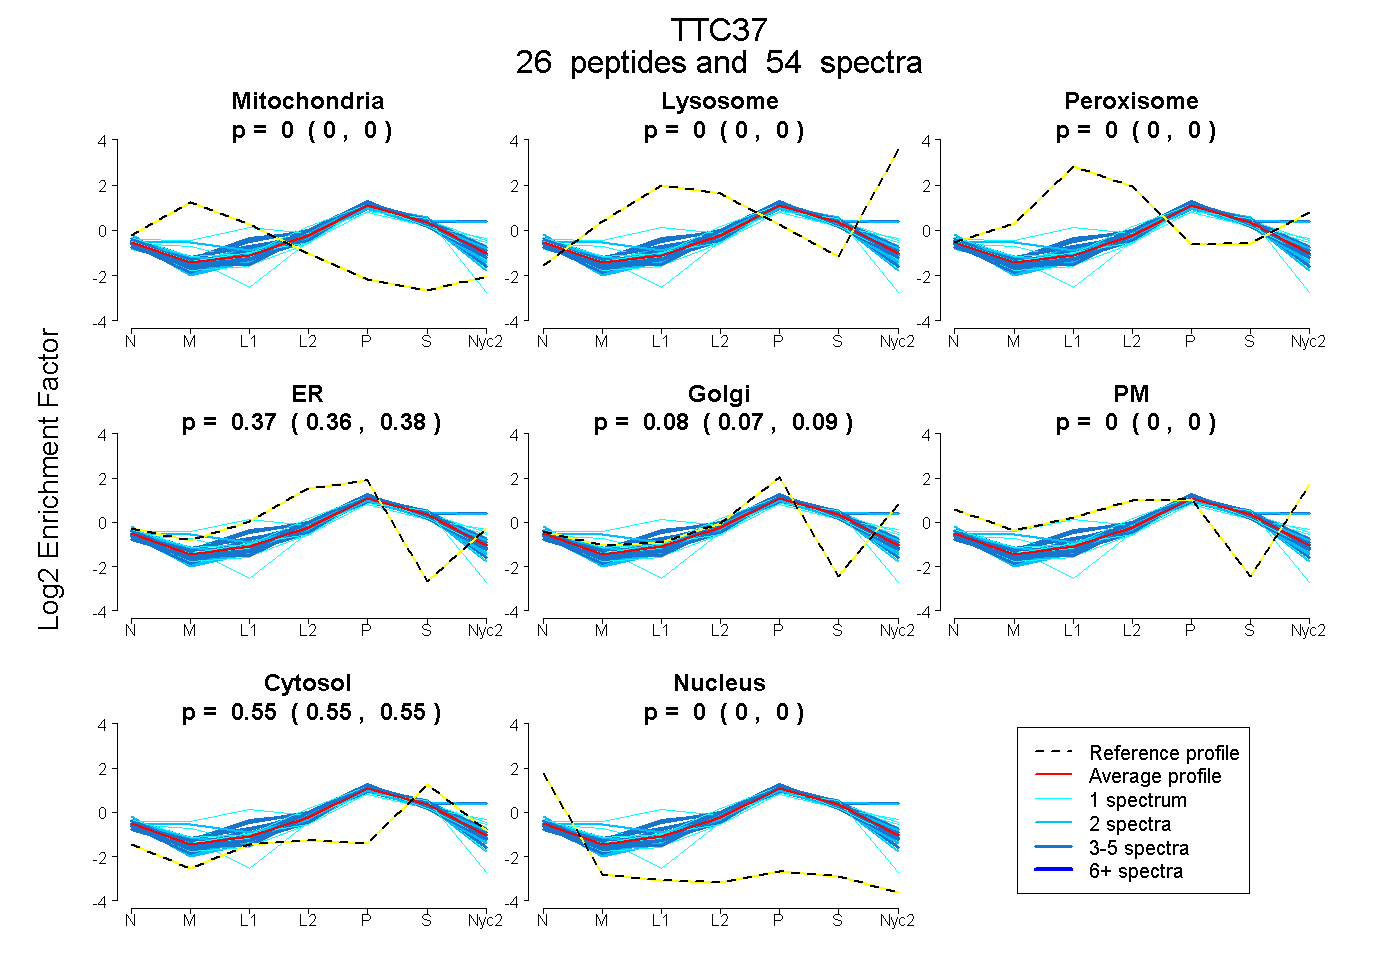
0.000 | 0.000
0.000 | 0.000
0.000 | 0.000
0.360 | 0.378
0.069 | 0.091
0.000 | 0.000
0.547 | 0.552
0.000 | 0.000
11peptides
spectra
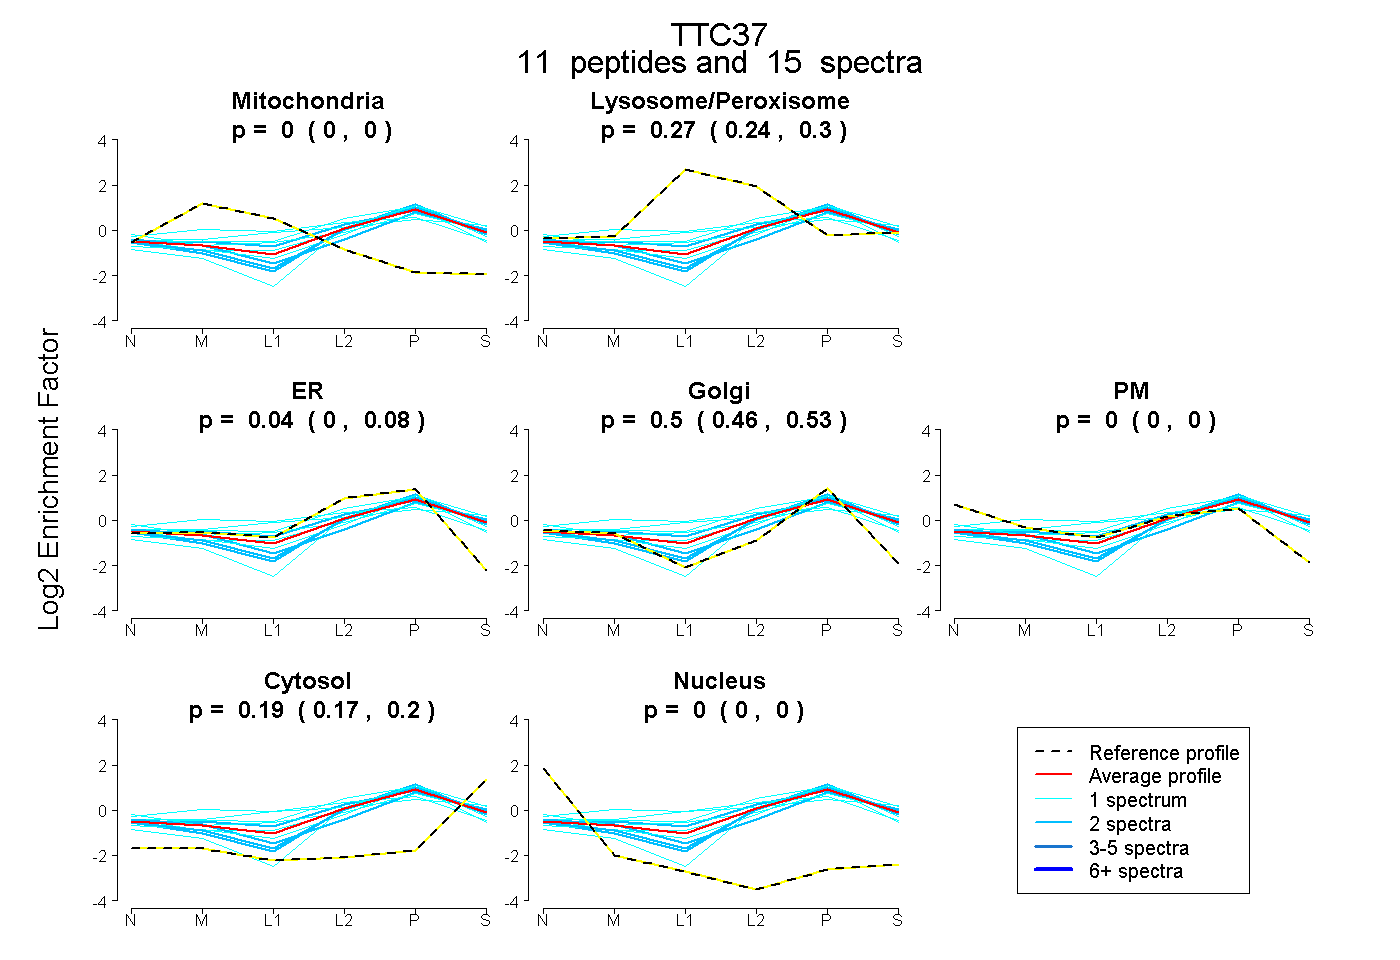
0.000 | 0.000
0.241 | 0.297
0.000 | 0.083
0.460 | 0.530
0.000 | 0.000
0.173 | 0.201
0.000 | 0.000
18peptides
spectra
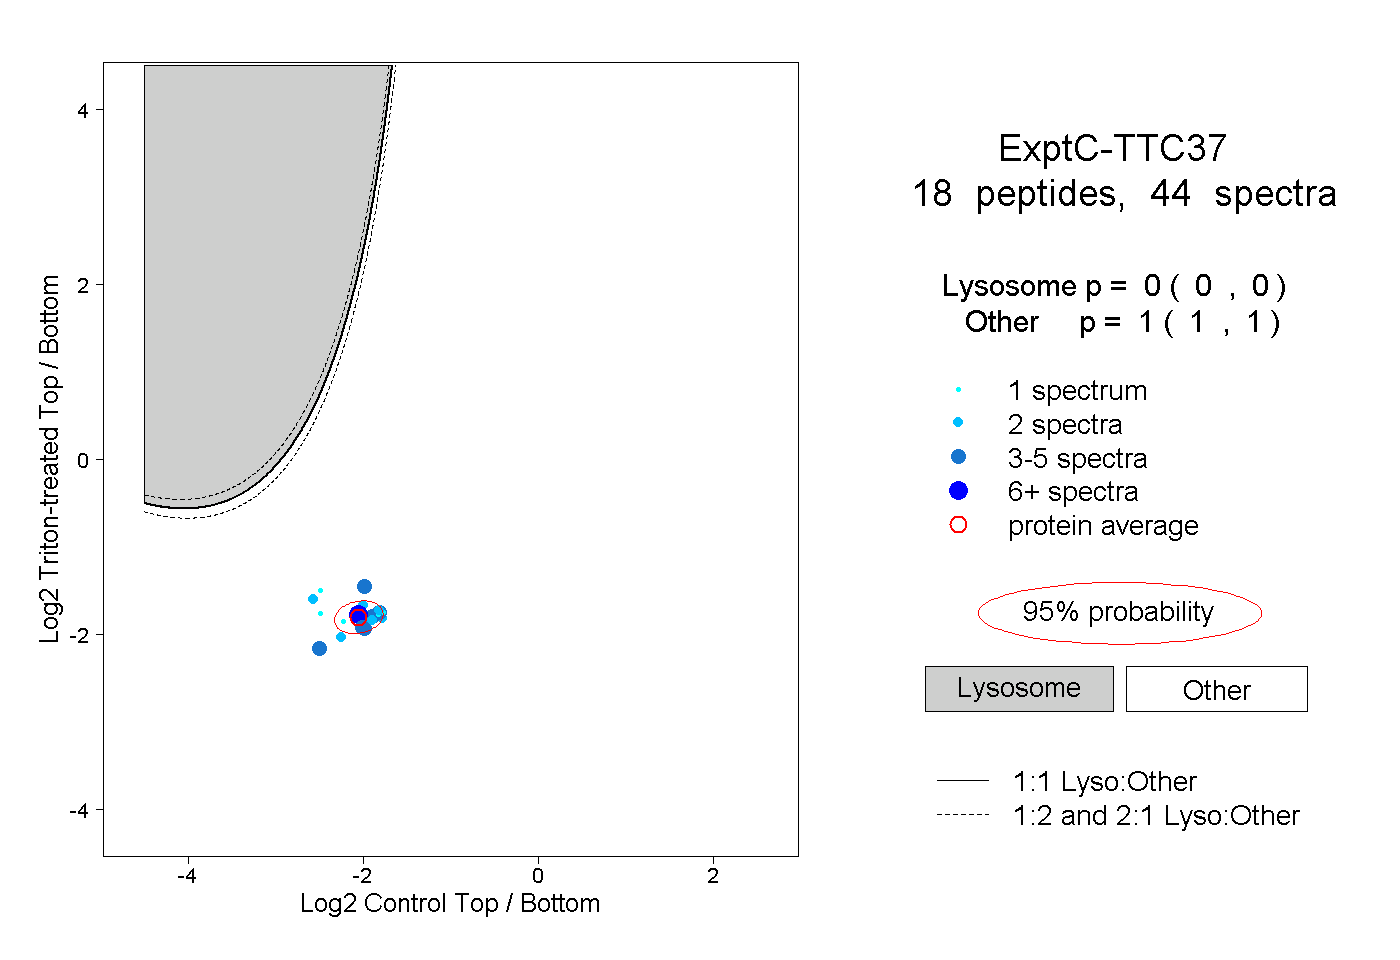
0.000 | 0.000
1.000 | 1.000
5peptides
spectra
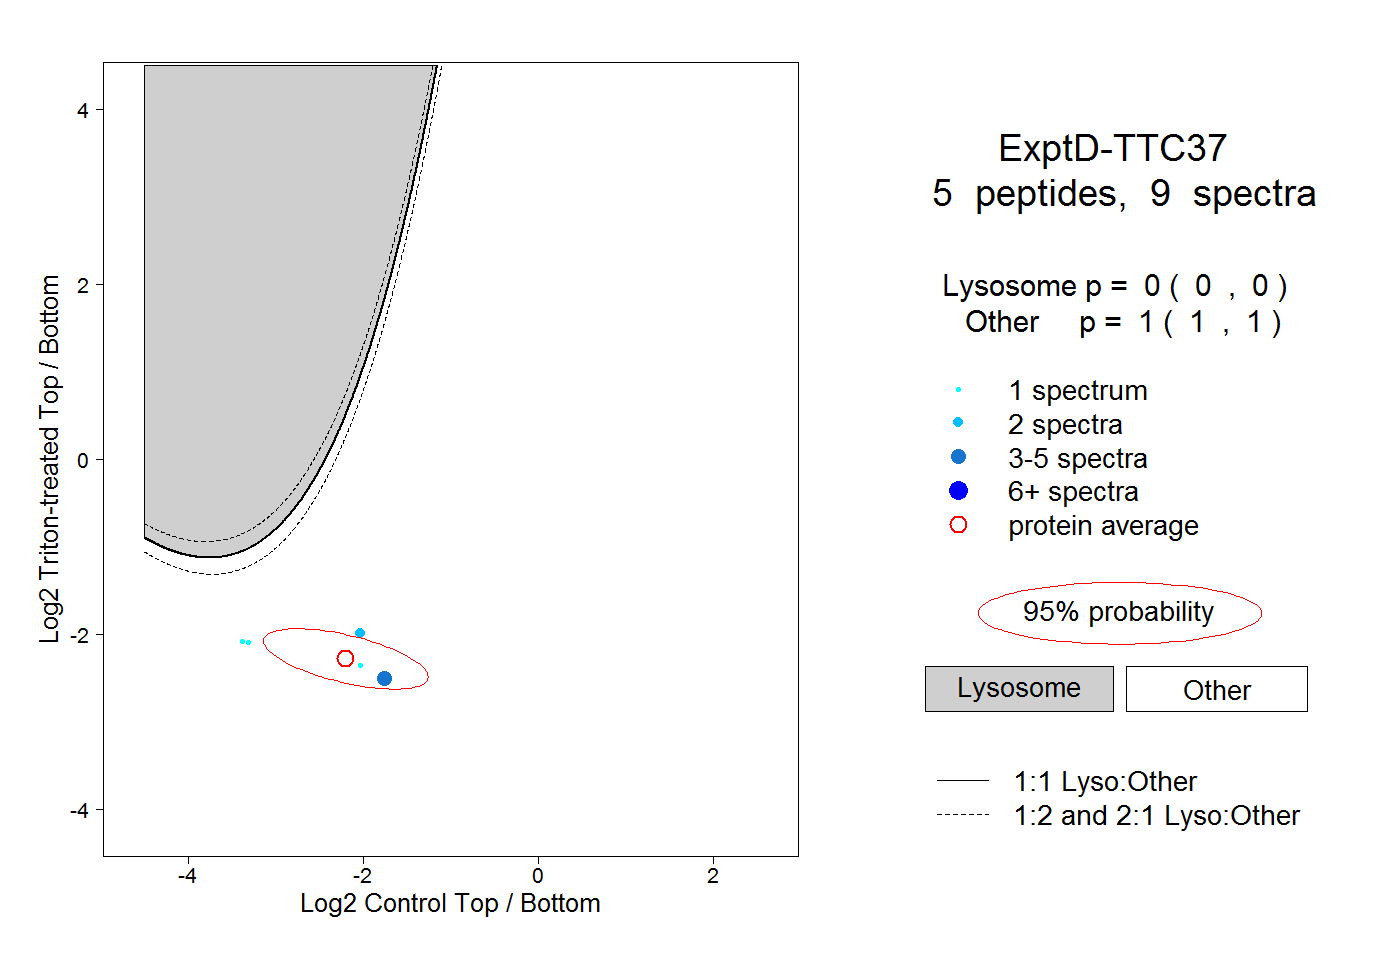
0.000 | 0.000
1.000 | 1.000