 26
26peptides
spectra
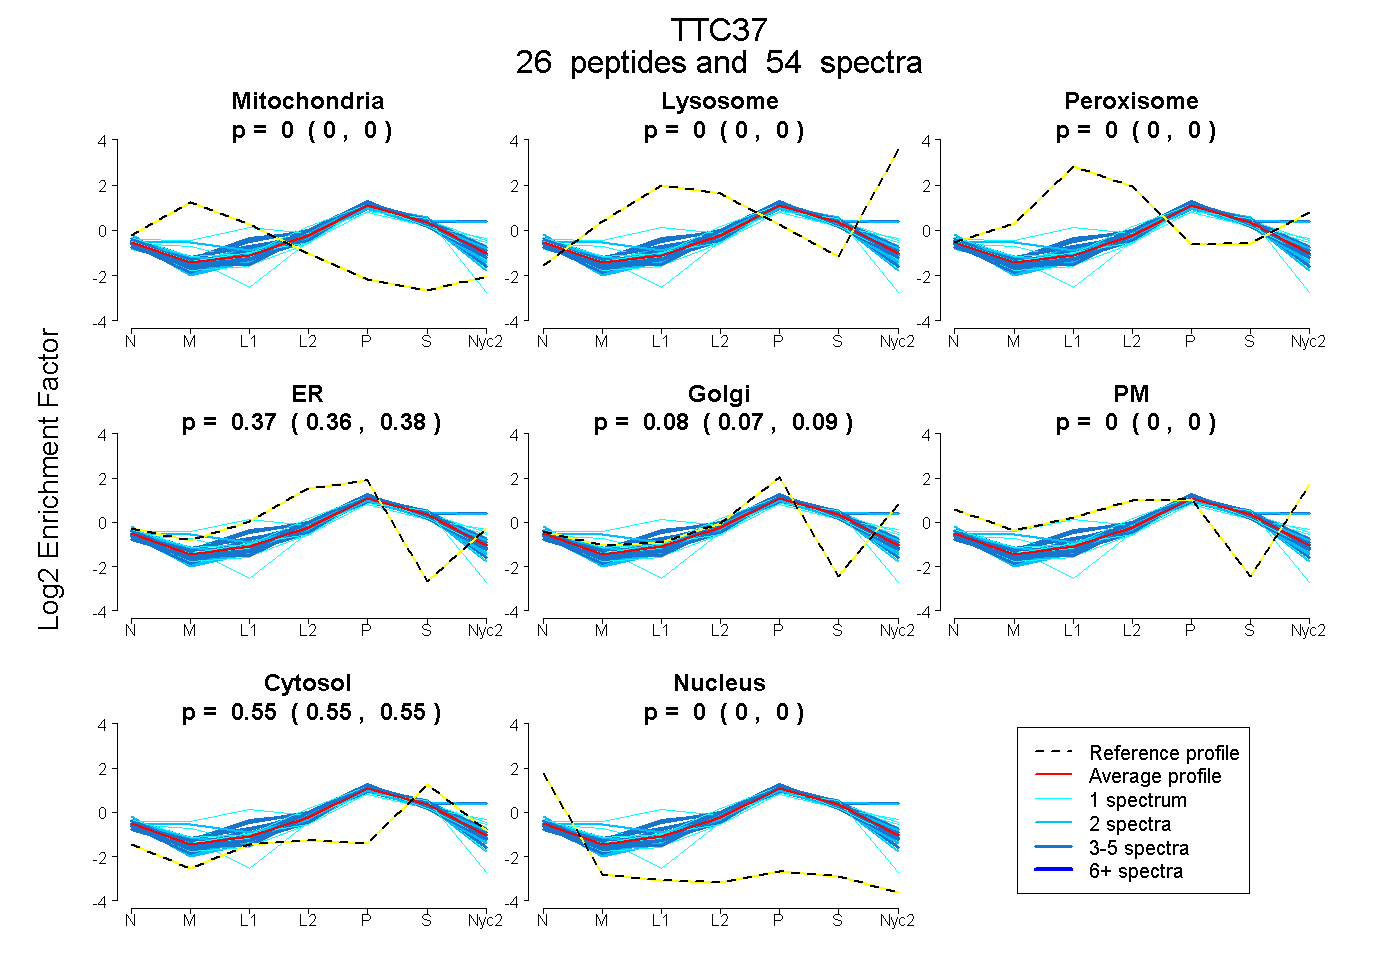
0.000 | 0.000
0.000 | 0.000
0.000 | 0.000
0.360 | 0.378
0.069 | 0.091
0.000 | 0.000
0.547 | 0.552
0.000 | 0.000
| Plot | Mito | Lyso | Perox | ER | Golgi | PM | Cytosol | Nucleus | |||||
| Expt A |
26 peptides |
54 spectra |
|
0.000 0.000 | 0.000 |
0.000 0.000 | 0.000 |
0.000 0.000 | 0.000 |
0.369 0.360 | 0.378 |
0.081 0.069 | 0.091 |
0.000 0.000 | 0.000 |
0.550 0.547 | 0.552 |
0.000 0.000 | 0.000 |
| 1 spectrum, DVAGDR | 0.000 | 0.000 | 0.000 | 0.292 | 0.231 | 0.000 | 0.477 | 0.000 | ||
| 2 spectra, SNPDQPAVILLLR | 0.074 | 0.000 | 0.000 | 0.440 | 0.000 | 0.000 | 0.486 | 0.000 | ||
| 2 spectra, DELLHLGGR | 0.000 | 0.000 | 0.000 | 0.292 | 0.154 | 0.000 | 0.554 | 0.000 | ||
| 1 spectrum, VSGALLGQQEGQEVLR | 0.000 | 0.000 | 0.000 | 0.511 | 0.000 | 0.000 | 0.489 | 0.000 | ||
| 1 spectrum, SSTAIK | 0.014 | 0.000 | 0.286 | 0.062 | 0.293 | 0.000 | 0.345 | 0.000 | ||
| 3 spectra, EAAEAYQR | 0.000 | 0.000 | 0.000 | 0.417 | 0.059 | 0.000 | 0.524 | 0.000 | ||
| 3 spectra, SGPGLIGLGIR | 0.000 | 0.000 | 0.000 | 0.385 | 0.023 | 0.000 | 0.573 | 0.019 | ||
| 3 spectra, FPHEMTR | 0.000 | 0.000 | 0.000 | 0.323 | 0.123 | 0.000 | 0.554 | 0.000 | ||
| 2 spectra, NFIQYLSK | 0.000 | 0.000 | 0.000 | 0.316 | 0.167 | 0.000 | 0.518 | 0.000 | ||
| 2 spectra, EAILSCNR | 0.000 | 0.000 | 0.000 | 0.433 | 0.000 | 0.000 | 0.545 | 0.023 | ||
| 1 spectrum, WCDVCK | 0.000 | 0.000 | 0.000 | 0.350 | 0.000 | 0.000 | 0.558 | 0.092 | ||
| 4 spectra, LVDLYHQEK | 0.000 | 0.000 | 0.000 | 0.449 | 0.000 | 0.000 | 0.551 | 0.000 | ||
| 3 spectra, WAWLR | 0.000 | 0.000 | 0.000 | 0.326 | 0.090 | 0.000 | 0.584 | 0.000 | ||
| 2 spectra, ESSTAYER | 0.000 | 0.000 | 0.000 | 0.332 | 0.080 | 0.000 | 0.586 | 0.002 | ||
| 1 spectrum, IVAQYTQQNAK | 0.000 | 0.000 | 0.000 | 0.023 | 0.449 | 0.000 | 0.528 | 0.000 | ||
| 1 spectrum, AVDYVEQALGYFTR | 0.000 | 0.000 | 0.000 | 0.353 | 0.055 | 0.000 | 0.593 | 0.000 | ||
| 2 spectra, GLYYLK | 0.000 | 0.042 | 0.000 | 0.000 | 0.404 | 0.068 | 0.487 | 0.000 | ||
| 1 spectrum, DCNCWESLGEAYLSR | 0.000 | 0.000 | 0.000 | 0.096 | 0.306 | 0.000 | 0.564 | 0.034 | ||
| 3 spectra, ALNHFLK | 0.000 | 0.000 | 0.015 | 0.474 | 0.000 | 0.000 | 0.512 | 0.000 | ||
| 2 spectra, AALVDFLDGK | 0.000 | 0.000 | 0.000 | 0.382 | 0.062 | 0.000 | 0.557 | 0.000 | ||
| 2 spectra, ASELSPDSTYSVFK | 0.000 | 0.000 | 0.000 | 0.363 | 0.000 | 0.000 | 0.627 | 0.010 | ||
| 1 spectrum, LLDLYESVDK | 0.000 | 0.000 | 0.000 | 0.394 | 0.000 | 0.000 | 0.579 | 0.028 | ||
| 3 spectra, ATALLHSAEDQHTYNVTVR | 0.000 | 0.055 | 0.143 | 0.000 | 0.400 | 0.000 | 0.402 | 0.000 | ||
| 4 spectra, IGSYETMDLFR | 0.000 | 0.000 | 0.000 | 0.375 | 0.091 | 0.000 | 0.534 | 0.000 | ||
| 1 spectrum, ISEAESLCTK | 0.000 | 0.000 | 0.000 | 0.303 | 0.107 | 0.000 | 0.590 | 0.000 | ||
| 3 spectra, VAAIQQILGR | 0.000 | 0.000 | 0.000 | 0.436 | 0.049 | 0.000 | 0.515 | 0.000 |
| Plot | Mito | Lyso or Perox | ER | Golgi | PM | Cytosol | Nucleus | ||||||
| Expt B |
11 peptides |
15 spectra |
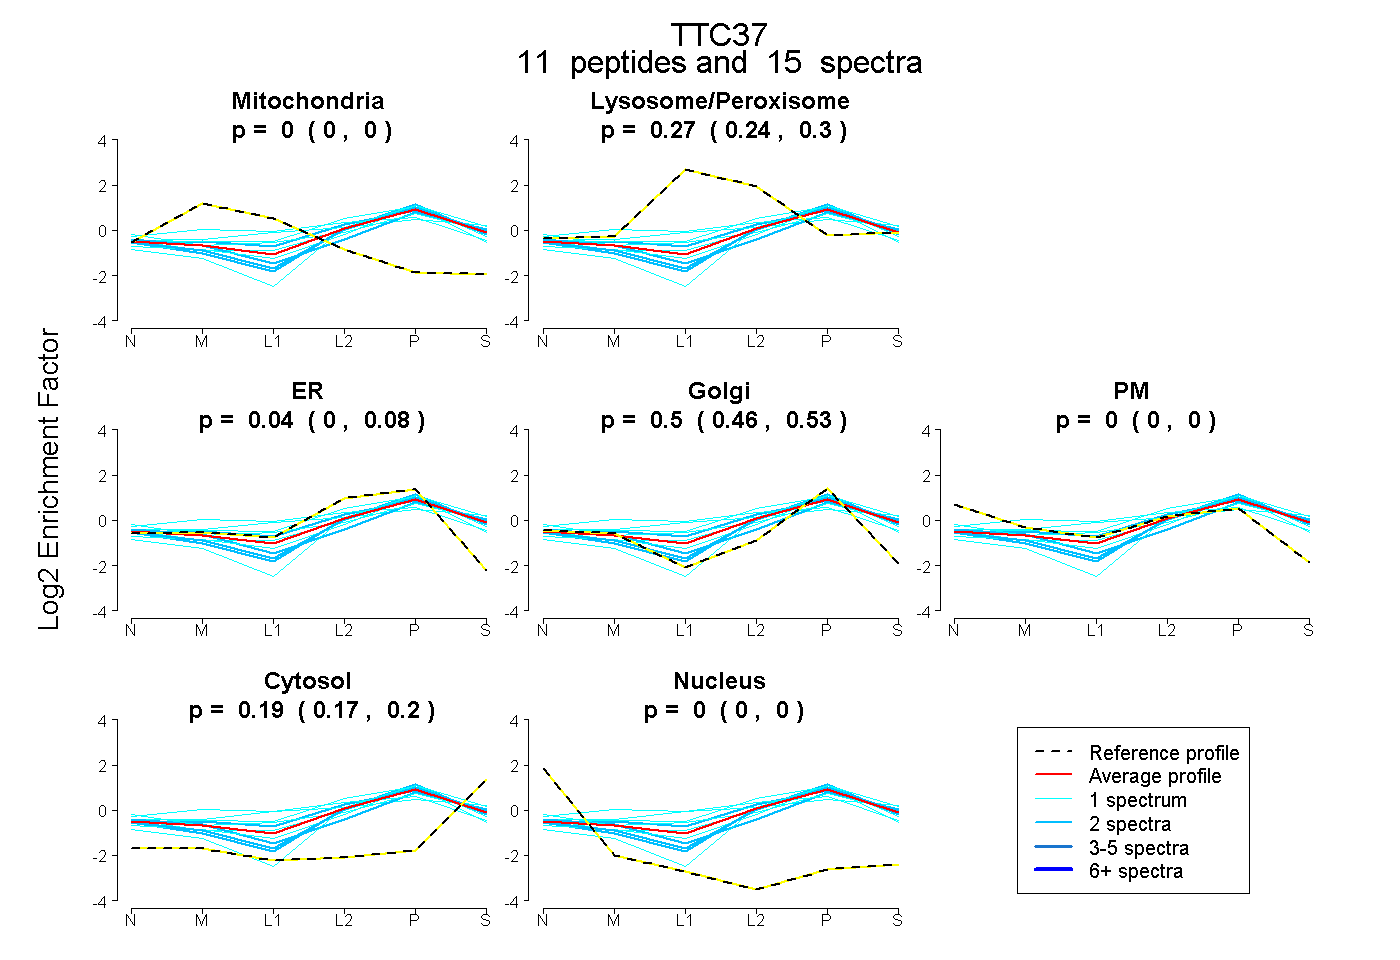 |
0.000 0.000 | 0.000 |
0.274 0.241 | 0.297 |
0.036 0.000 | 0.083 |
0.504 0.460 | 0.530 |
0.000 0.000 | 0.000 |
0.187 0.173 | 0.201 |
0.000 0.000 | 0.000 |
|||
| Plot | Lyso | Other | |||||||||||
| Expt C |
18 peptides |
44 spectra |
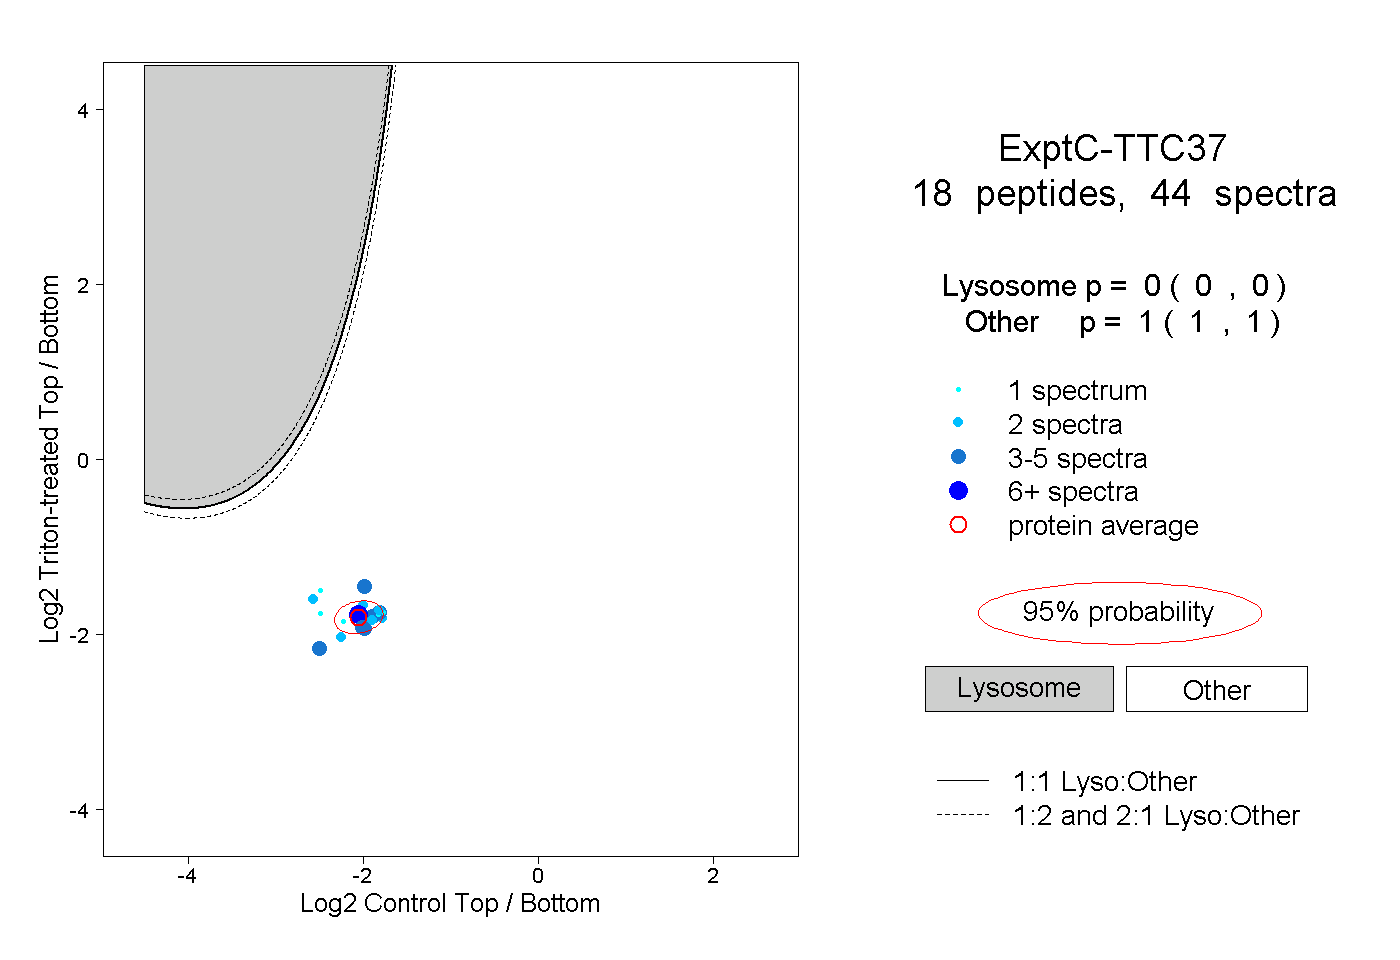 |
0.000 0.000 | 0.000 |
1.000 1.000 | 1.000 |
||||||||
| Plot | Lyso | Other | |||||||||||
| Expt D |
5 peptides |
9 spectra |
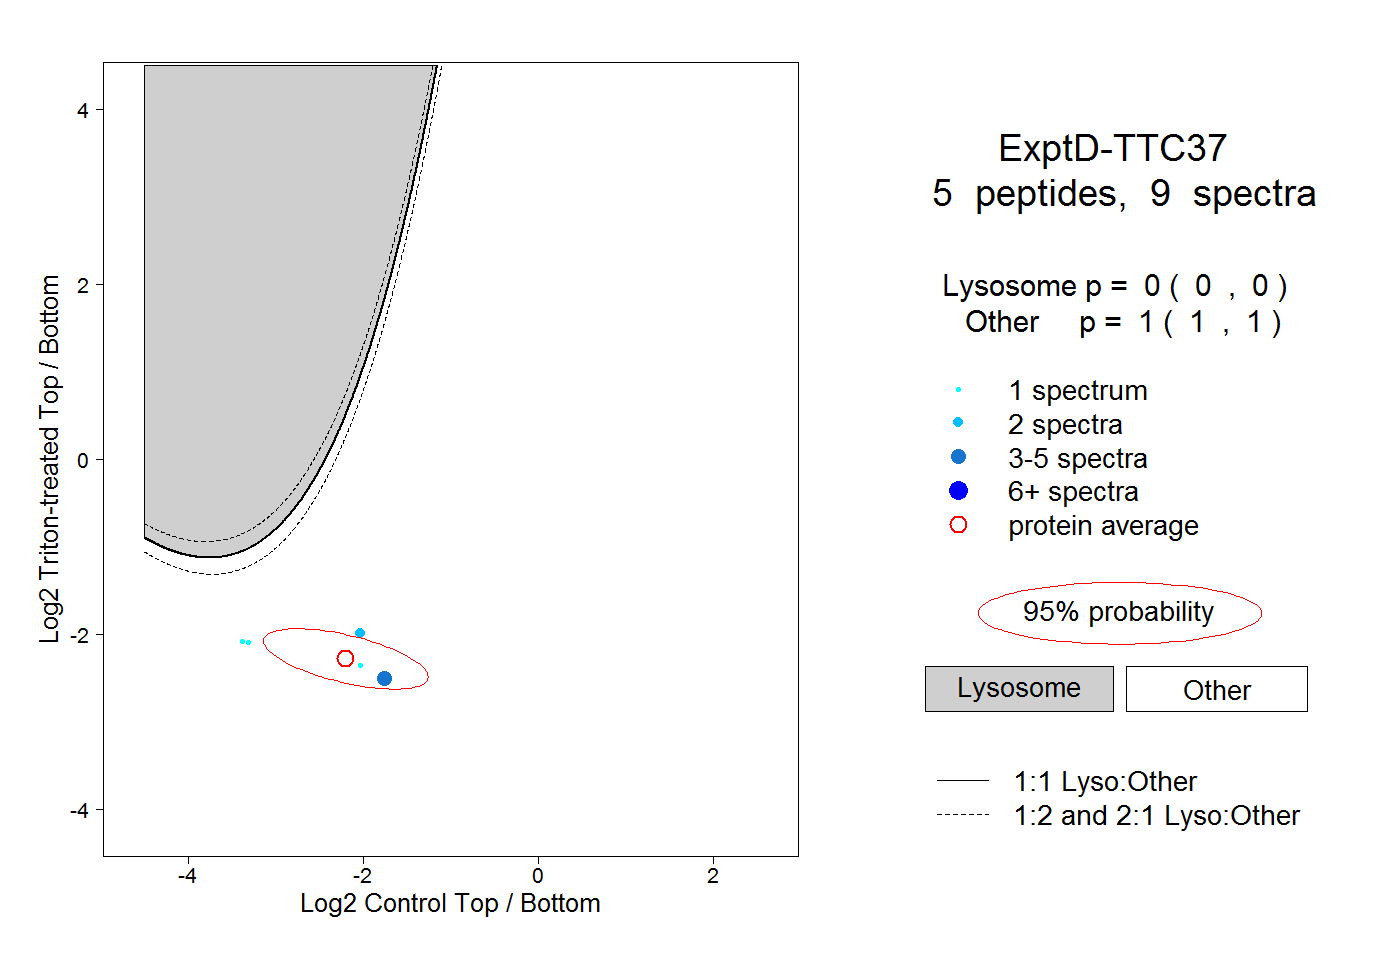 |
0.000 0.000 | 0.000 |
1.000 1.000 | 1.000 |