 4
4peptides
spectra
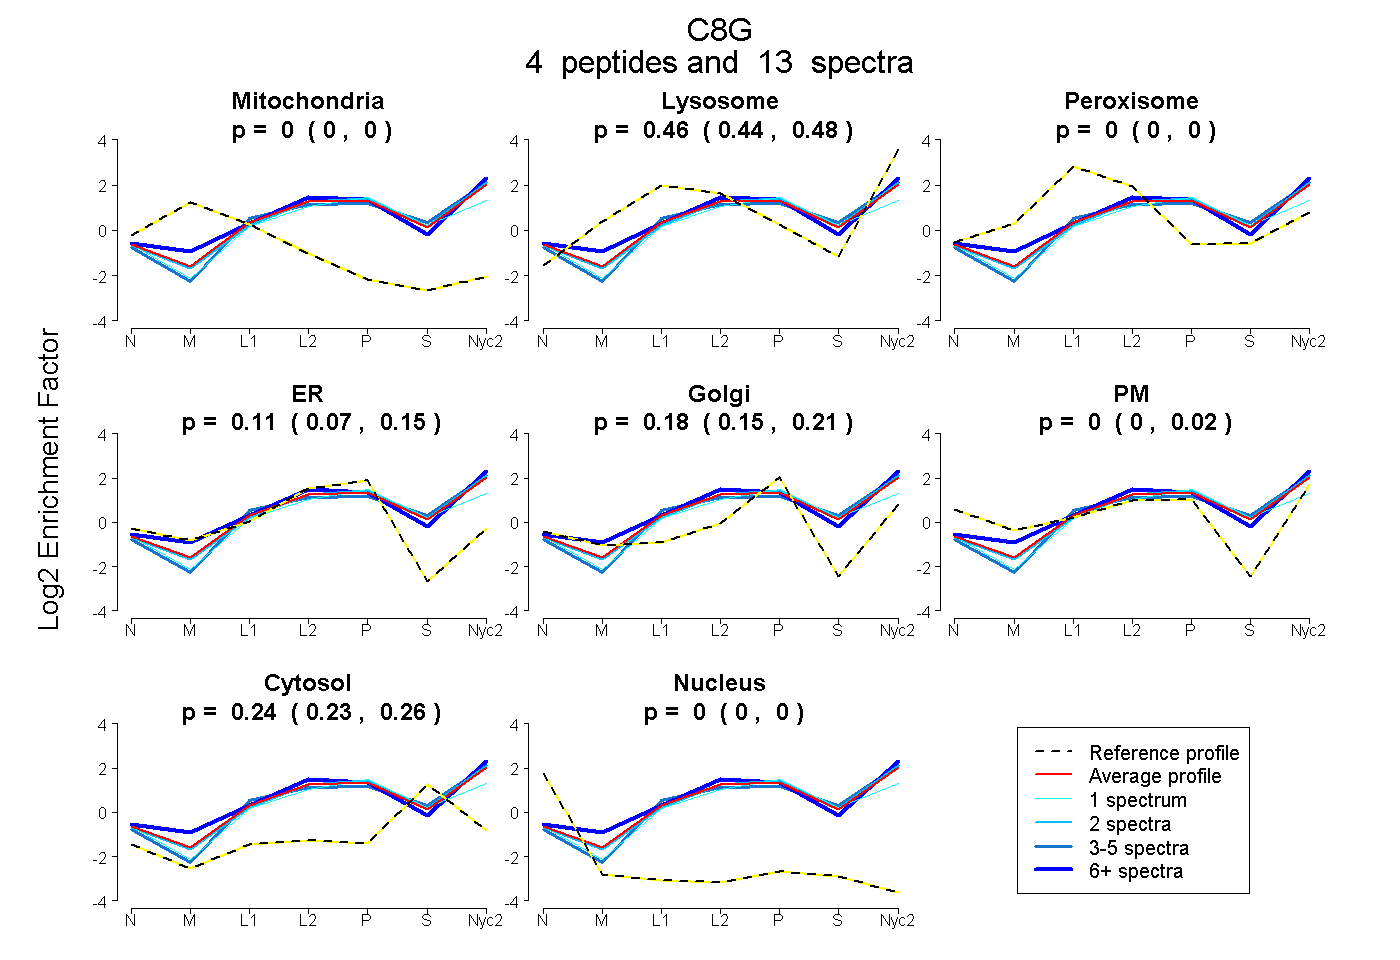
0.000 | 0.000
0.440 | 0.476
0.000 | 0.000
0.073 | 0.145
0.148 | 0.213
0.000 | 0.017
0.229 | 0.255
0.000 | 0.000
1peptide
spectra
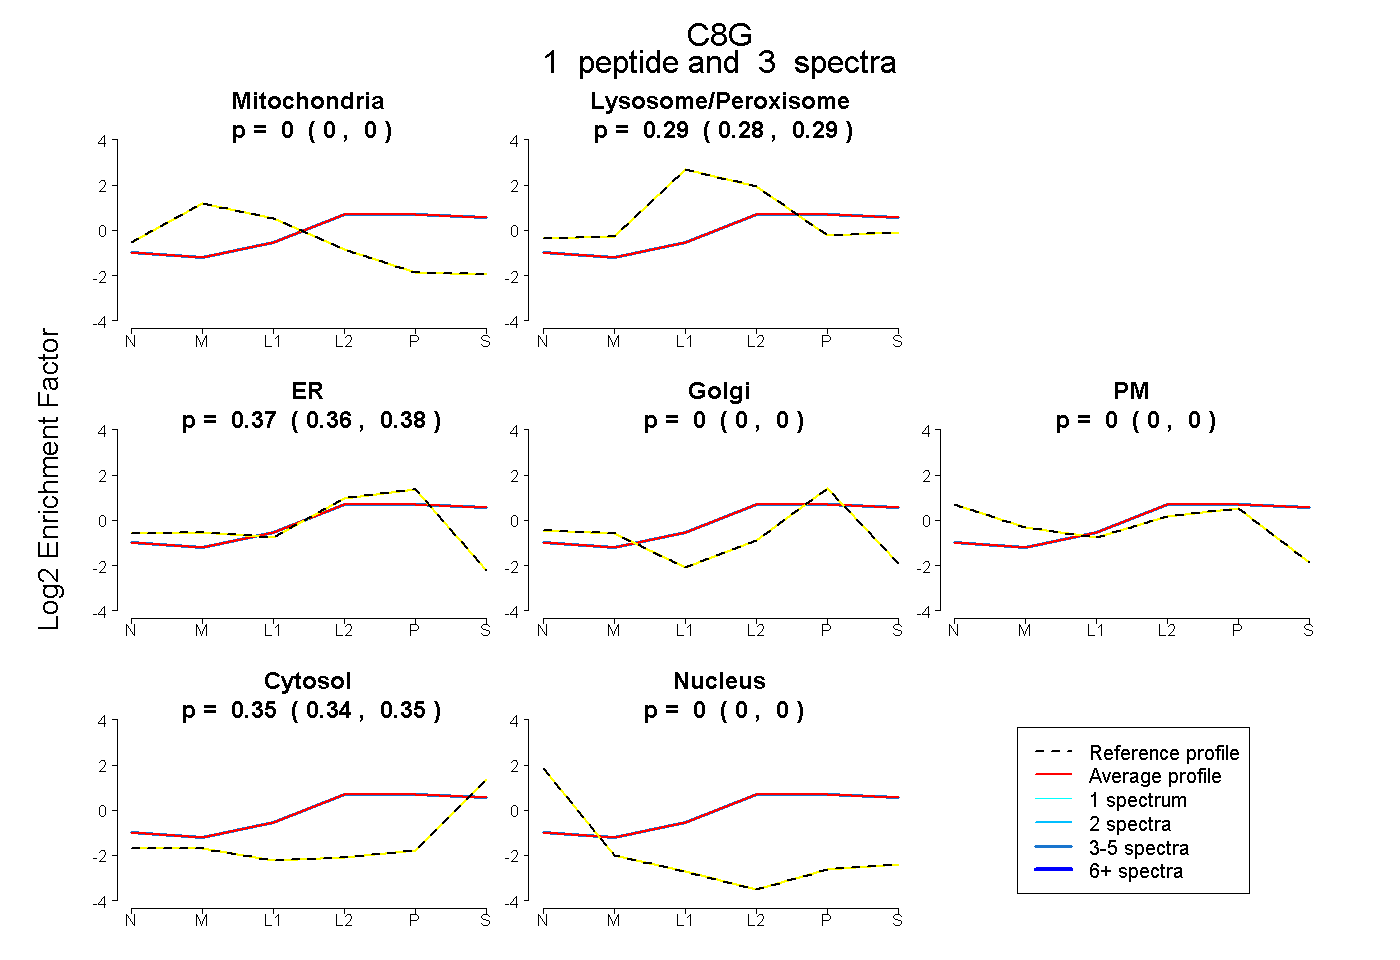
0.000 | 0.000
0.275 | 0.295
0.360 | 0.375
0.000 | 0.000
0.000 | 0.000
0.341 | 0.350
0.000 | 0.000
5peptides
spectra
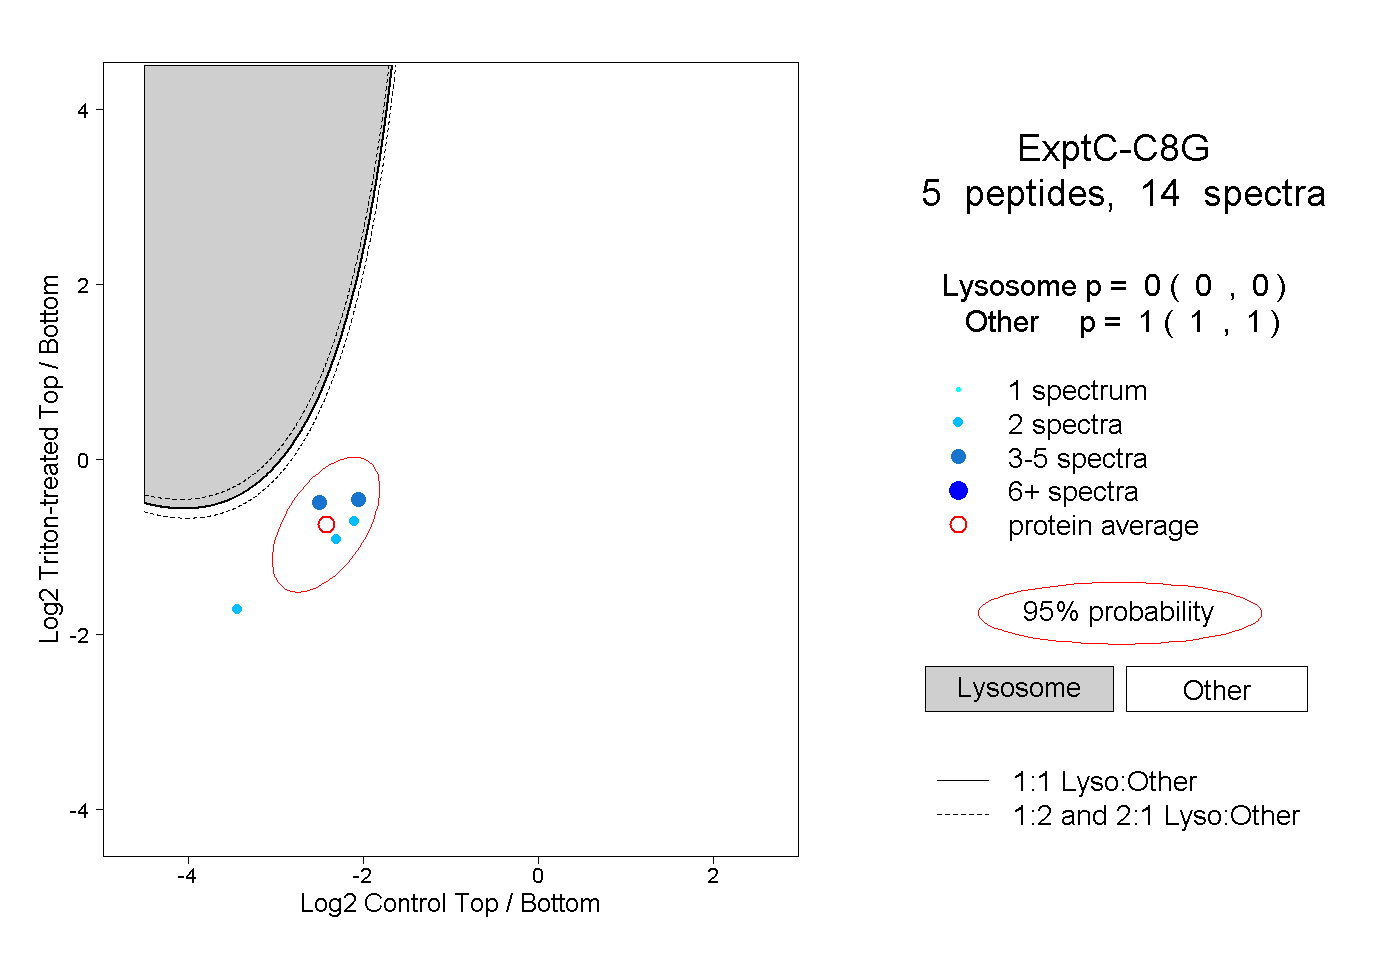
0.000 | 0.000
1.000 | 1.000