 4
4peptides
spectra
0.000 | 0.000
0.440 | 0.476
0.000 | 0.000
0.073 | 0.145
0.148 | 0.213
0.000 | 0.017
0.229 | 0.255
0.000 | 0.000
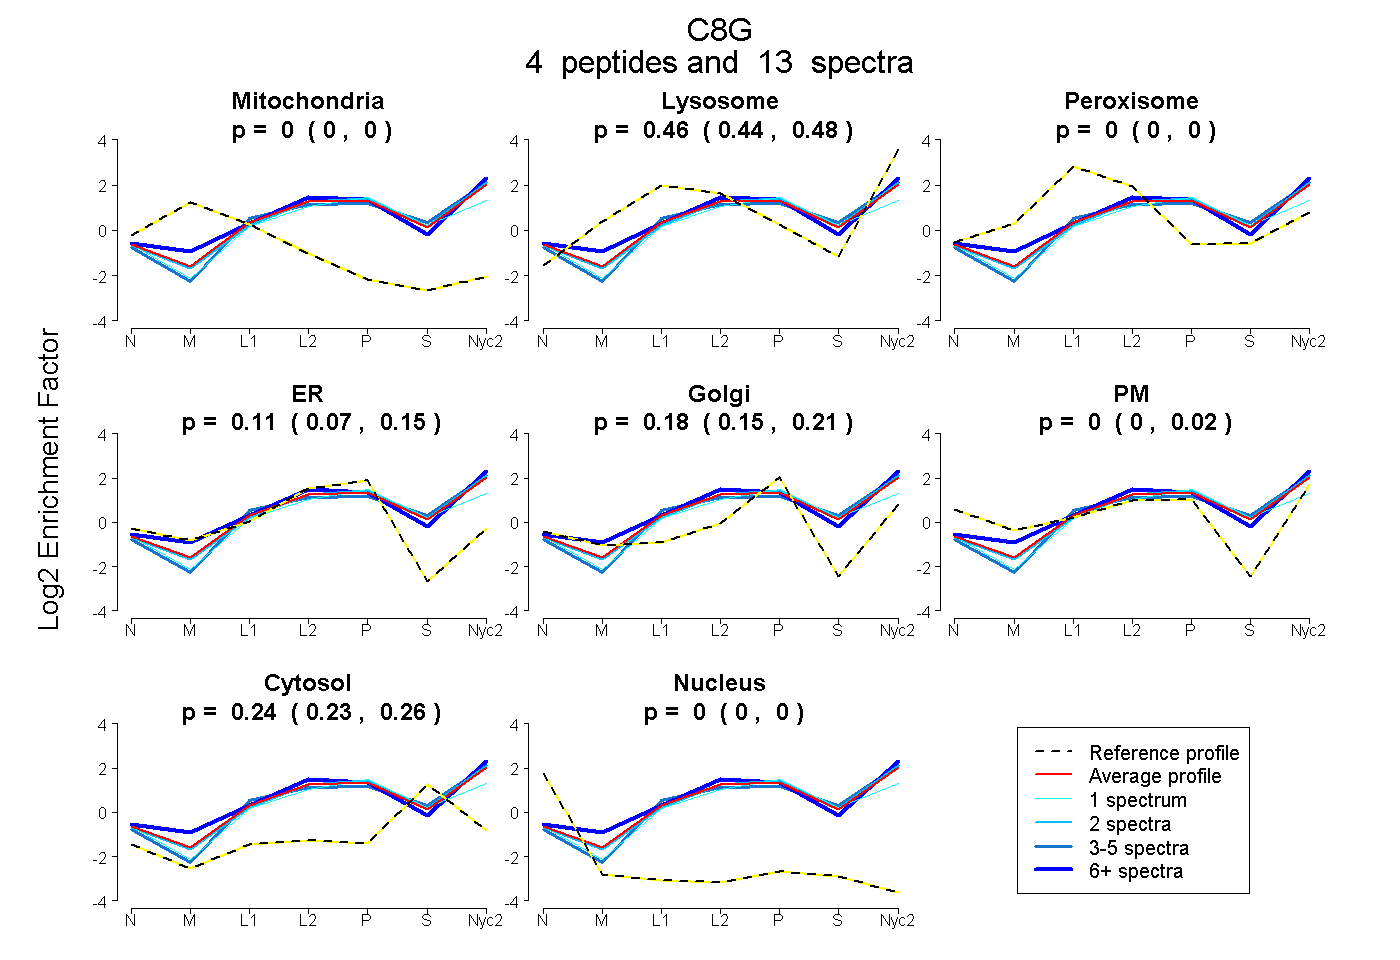
| Plot | Mito | Lyso | Perox | ER | Golgi | PM | Cytosol | Nucleus | |||||
| Expt A |
4 peptides |
13 spectra |
|
0.000 0.000 | 0.000 |
0.461 0.440 | 0.476 |
0.000 0.000 | 0.000 |
0.112 0.073 | 0.145 |
0.185 0.148 | 0.213 |
0.000 0.000 | 0.017 |
0.242 0.229 | 0.255 |
0.000 0.000 | 0.000 |
| 2 spectra, QLYGITGVPGR | 0.000 | 0.460 | 0.000 | 0.053 | 0.248 | 0.000 | 0.240 | 0.000 | ||
| 1 spectrum, YGFCETADQFHILNEMPK | 0.000 | 0.311 | 0.000 | 0.232 | 0.135 | 0.000 | 0.322 | 0.000 | ||
| 7 spectra, FLLQAPR | 0.000 | 0.497 | 0.000 | 0.069 | 0.180 | 0.097 | 0.157 | 0.000 | ||
| 3 spectra, AEATTLHIAPQGAAMAASTFR | 0.000 | 0.477 | 0.000 | 0.059 | 0.156 | 0.000 | 0.308 | 0.000 |
| Plot | Mito | Lyso or Perox | ER | Golgi | PM | Cytosol | Nucleus | ||||||
| Expt B |
1 peptide |
3 spectra |
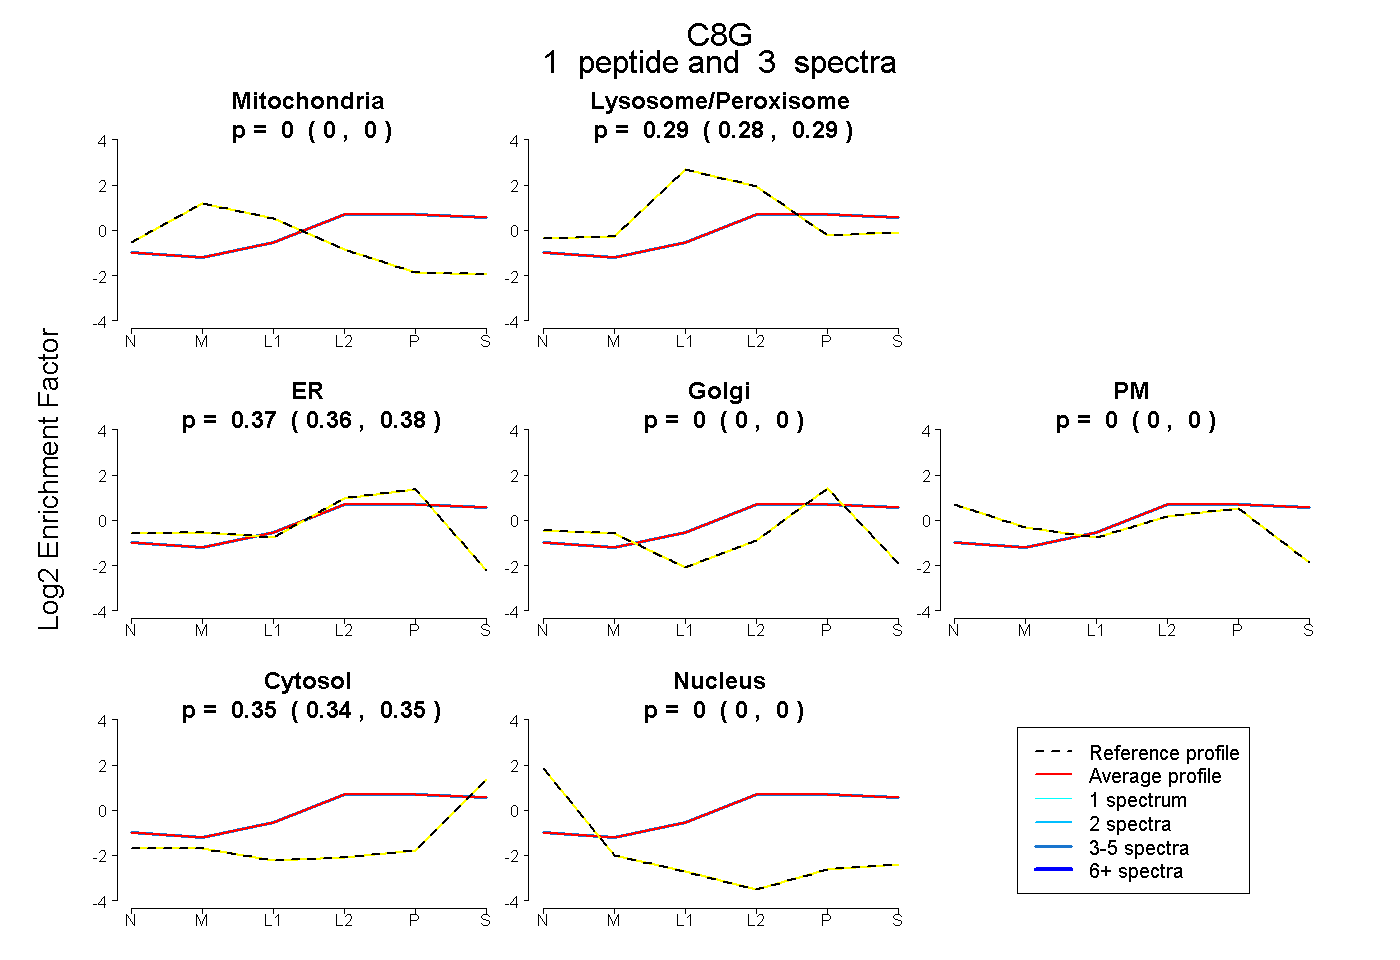 |
0.000 0.000 | 0.000 |
0.286 0.275 | 0.295 |
0.369 0.360 | 0.375 |
0.000 0.000 | 0.000 |
0.000 0.000 | 0.000 |
0.345 0.341 | 0.350 |
0.000 0.000 | 0.000 |
|||
| Plot | Lyso | Other | |||||||||||
| Expt C |
5 peptides |
14 spectra |
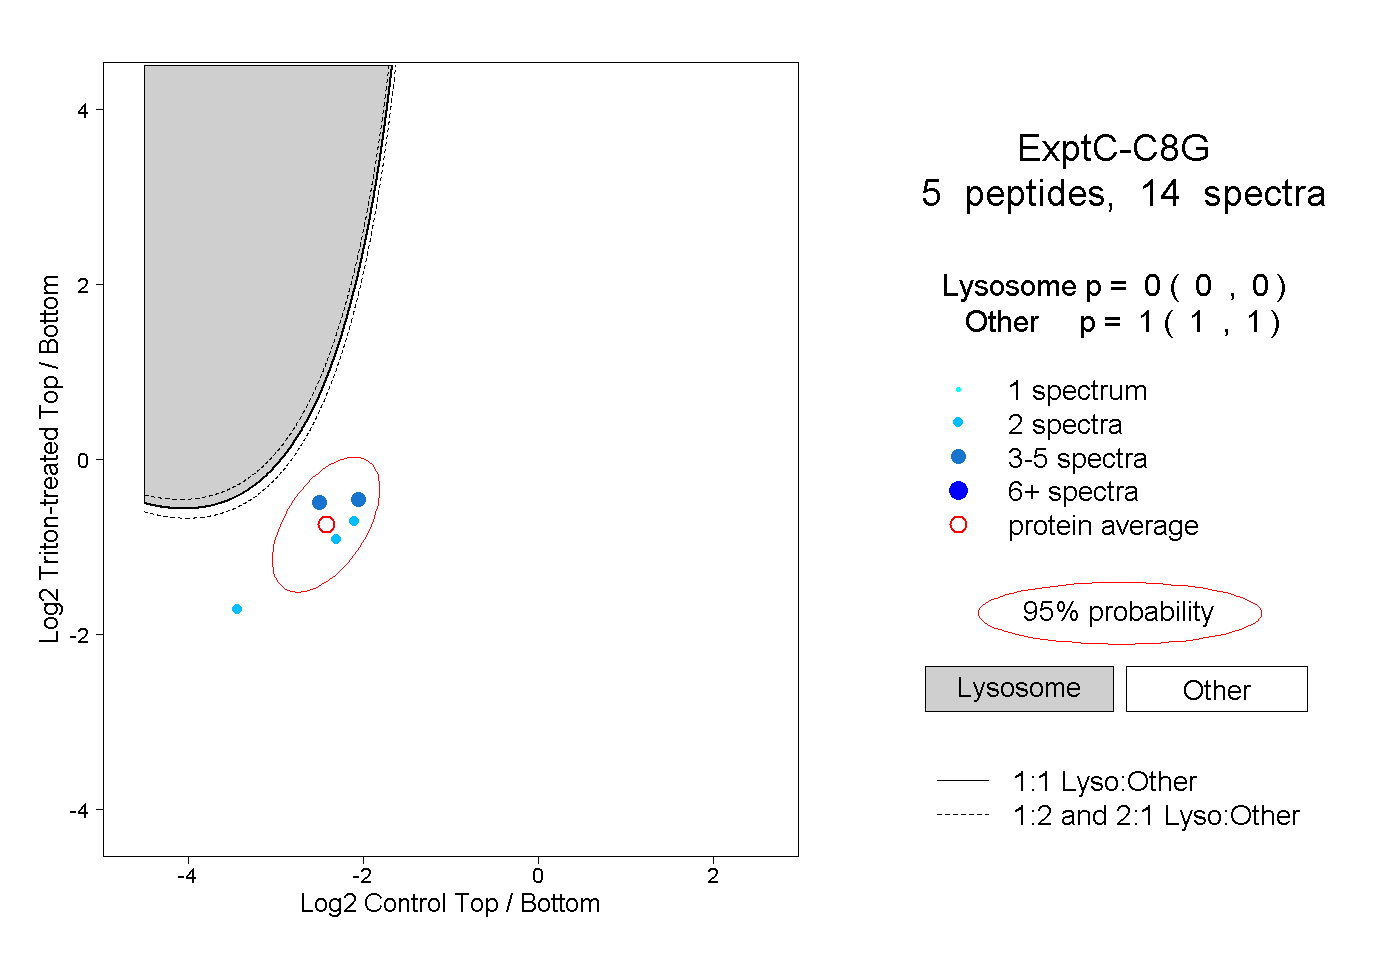 |
0.000 0.000 | 0.000 |
1.000 1.000 | 1.000 |