 9
9peptides
spectra
0.000 | 0.000
0.000 | 0.000
0.000 | 0.000
0.000 | 0.000
0.906 | 0.931
0.000 | 0.000
0.067 | 0.092
0.000 | 0.000
7peptides
spectra
0.000 | 0.000
1.000 | 1.000
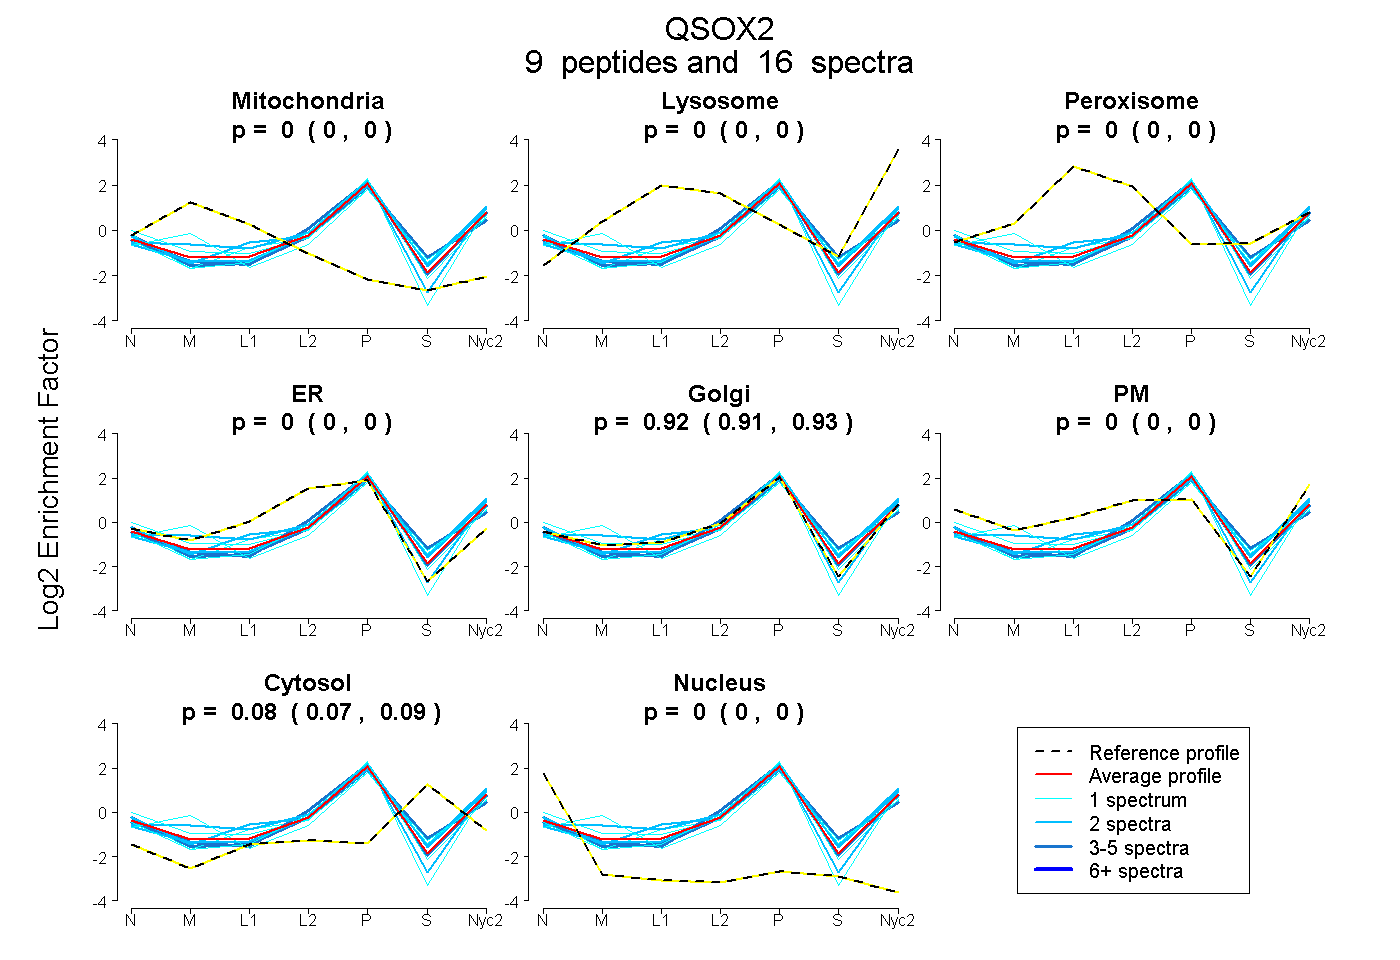
| Plot | Mito | Lyso | Perox | ER | Golgi | PM | Cytosol | Nucleus | |||||
| Expt A |
9 peptides |
16 spectra |
|
0.000 0.000 | 0.000 |
0.000 0.000 | 0.000 |
0.000 0.000 | 0.000 |
0.000 0.000 | 0.000 |
0.920 0.906 | 0.931 |
0.000 0.000 | 0.000 |
0.080 0.067 | 0.092 |
0.000 0.000 | 0.000 |
||
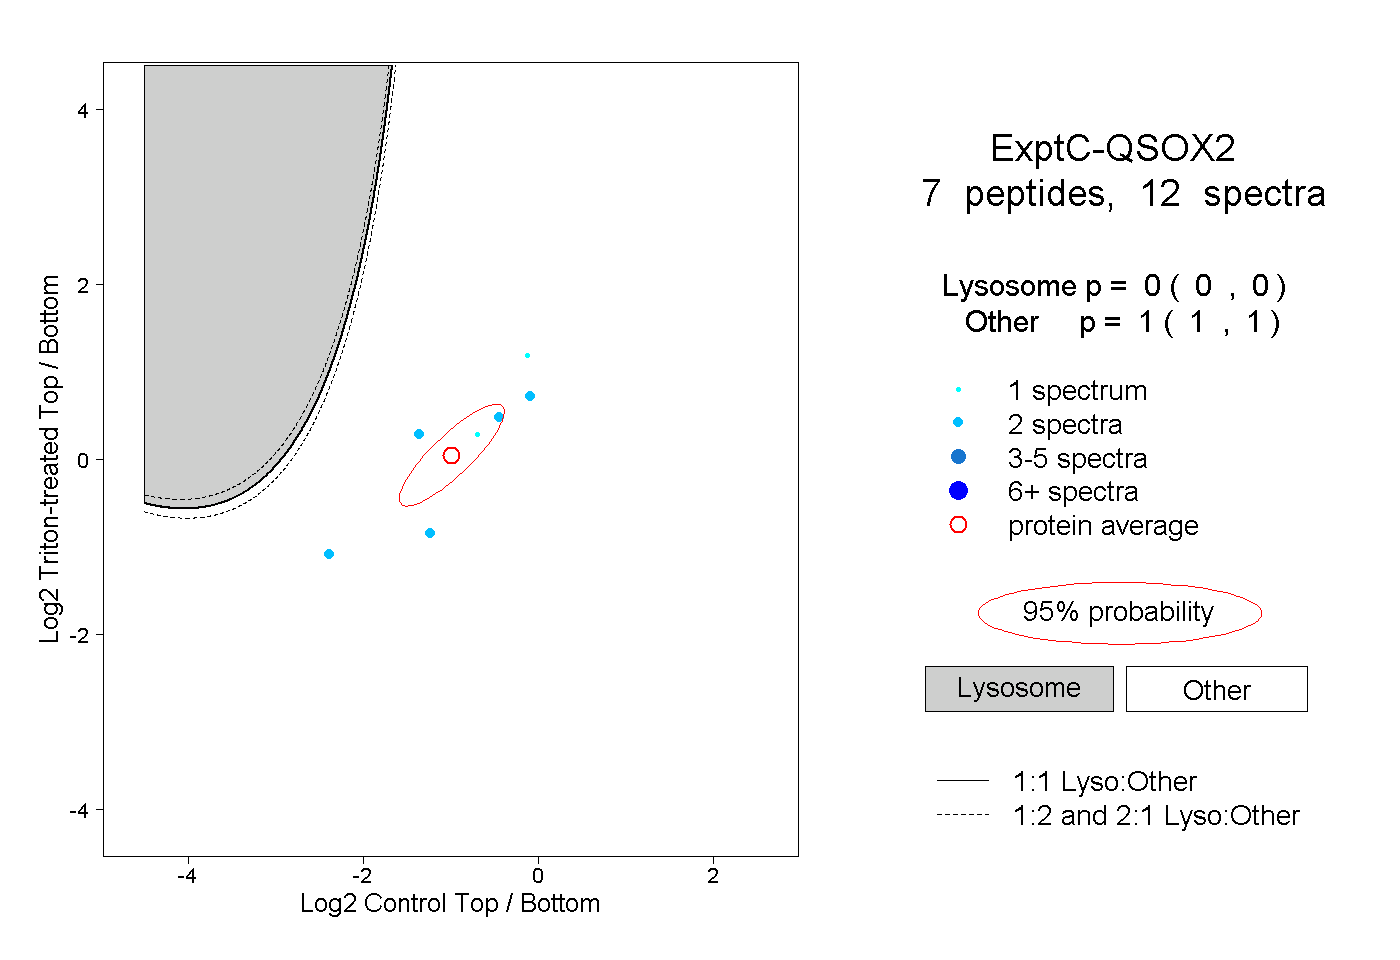
| Plot | Lyso | Other | |||||||||||
| Expt C |
7 peptides |
12 spectra |
|
0.000 0.000 | 0.000 |
1.000 1.000 | 1.000 |