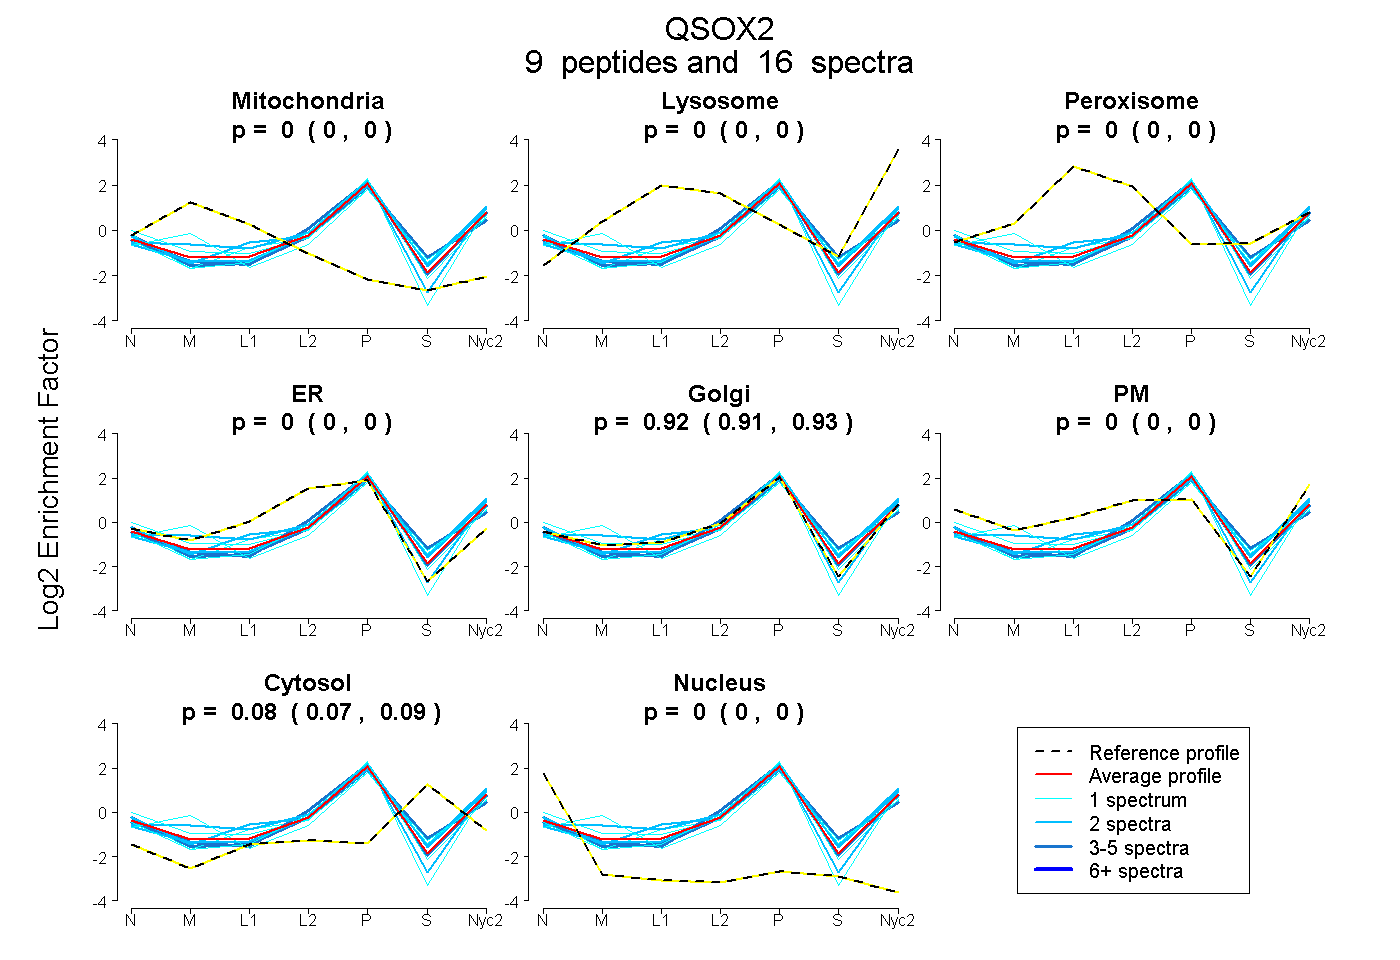
 9
9peptides
spectra
0.000 | 0.000
0.000 | 0.000
0.000 | 0.000
0.000 | 0.000
0.906 | 0.931
0.000 | 0.000
0.067 | 0.092
0.000 | 0.000
| Plot | Mito | Lyso | Perox | ER | Golgi | PM | Cytosol | Nucleus | |||||
| Expt A |
9 peptides |
16 spectra |
|
0.000 0.000 | 0.000 |
0.000 0.000 | 0.000 |
0.000 0.000 | 0.000 |
0.000 0.000 | 0.000 |
0.920 0.906 | 0.931 |
0.000 0.000 | 0.000 |
0.080 0.067 | 0.092 |
0.000 0.000 | 0.000 |
| 2 spectra, TADQAVLWLWR | 0.000 | 0.000 | 0.000 | 0.000 | 0.895 | 0.000 | 0.105 | 0.000 | ||
| 2 spectra, SFFSSYLK | 0.000 | 0.000 | 0.000 | 0.000 | 0.990 | 0.010 | 0.000 | 0.000 | ||
| 1 spectrum, VGEDAVWLLDSGSVR | 0.000 | 0.000 | 0.000 | 0.000 | 0.934 | 0.000 | 0.055 | 0.011 | ||
| 1 spectrum, VAALDCAEEK | 0.028 | 0.000 | 0.000 | 0.000 | 0.840 | 0.000 | 0.132 | 0.000 | ||
| 1 spectrum, IPYNAILDLVNNK | 0.000 | 0.000 | 0.000 | 0.000 | 0.988 | 0.000 | 0.000 | 0.012 | ||
| 2 spectra, LYTADLESGLHYLLR | 0.000 | 0.111 | 0.000 | 0.000 | 0.811 | 0.000 | 0.078 | 0.000 | ||
| 3 spectra, LFPGRPPVK | 0.000 | 0.000 | 0.000 | 0.000 | 0.937 | 0.000 | 0.063 | 0.000 | ||
| 1 spectrum, SLAGAQLK | 0.000 | 0.000 | 0.000 | 0.000 | 0.766 | 0.069 | 0.166 | 0.000 | ||
| 3 spectra, ECGEHFEEMAK | 0.000 | 0.000 | 0.000 | 0.000 | 0.798 | 0.000 | 0.202 | 0.000 |
| Plot | Lyso | Other | |||||||||||
| Expt C |
7 peptides |
12 spectra |
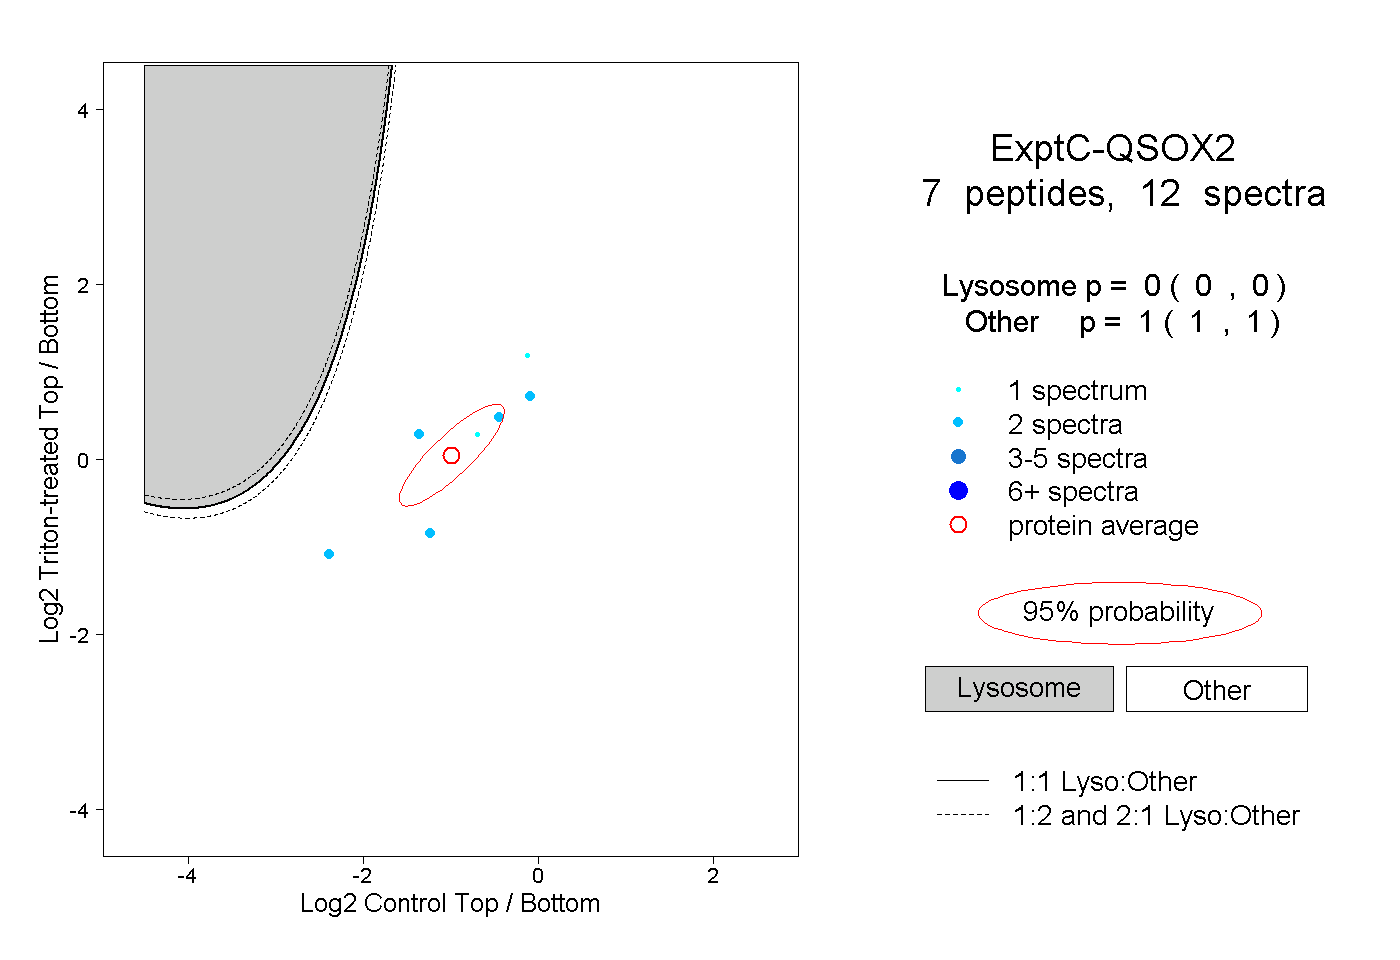 |
0.000 0.000 | 0.000 |
1.000 1.000 | 1.000 |