 7
7peptides
spectra
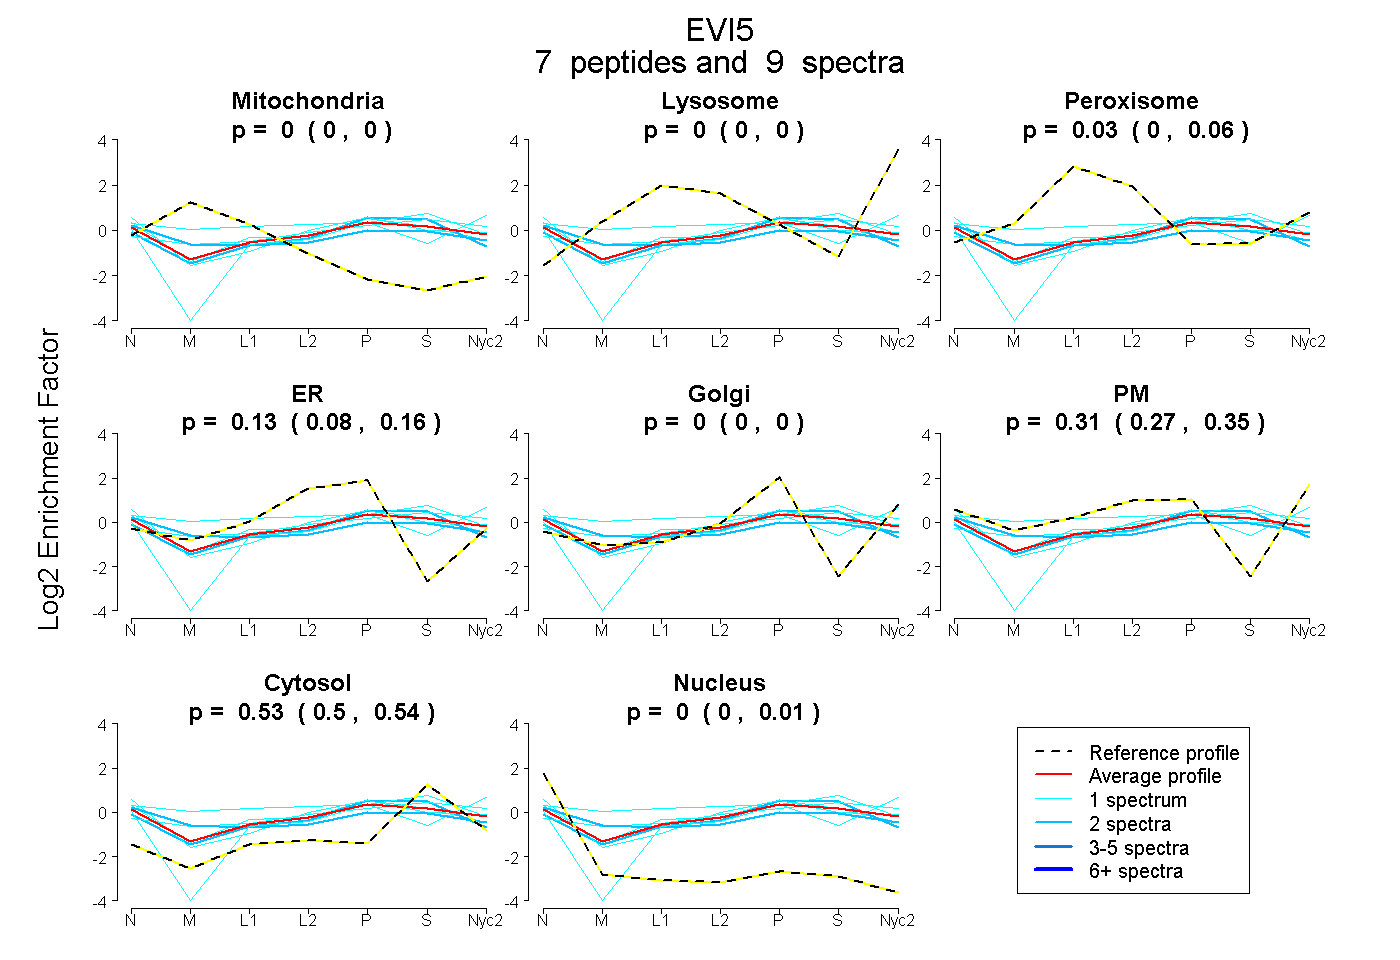
0.000 | 0.000
0.000 | 0.000
0.002 | 0.059
0.082 | 0.164
0.000 | 0.000
0.265 | 0.354
0.498 | 0.543
0.000 | 0.011
1peptide
spectrum
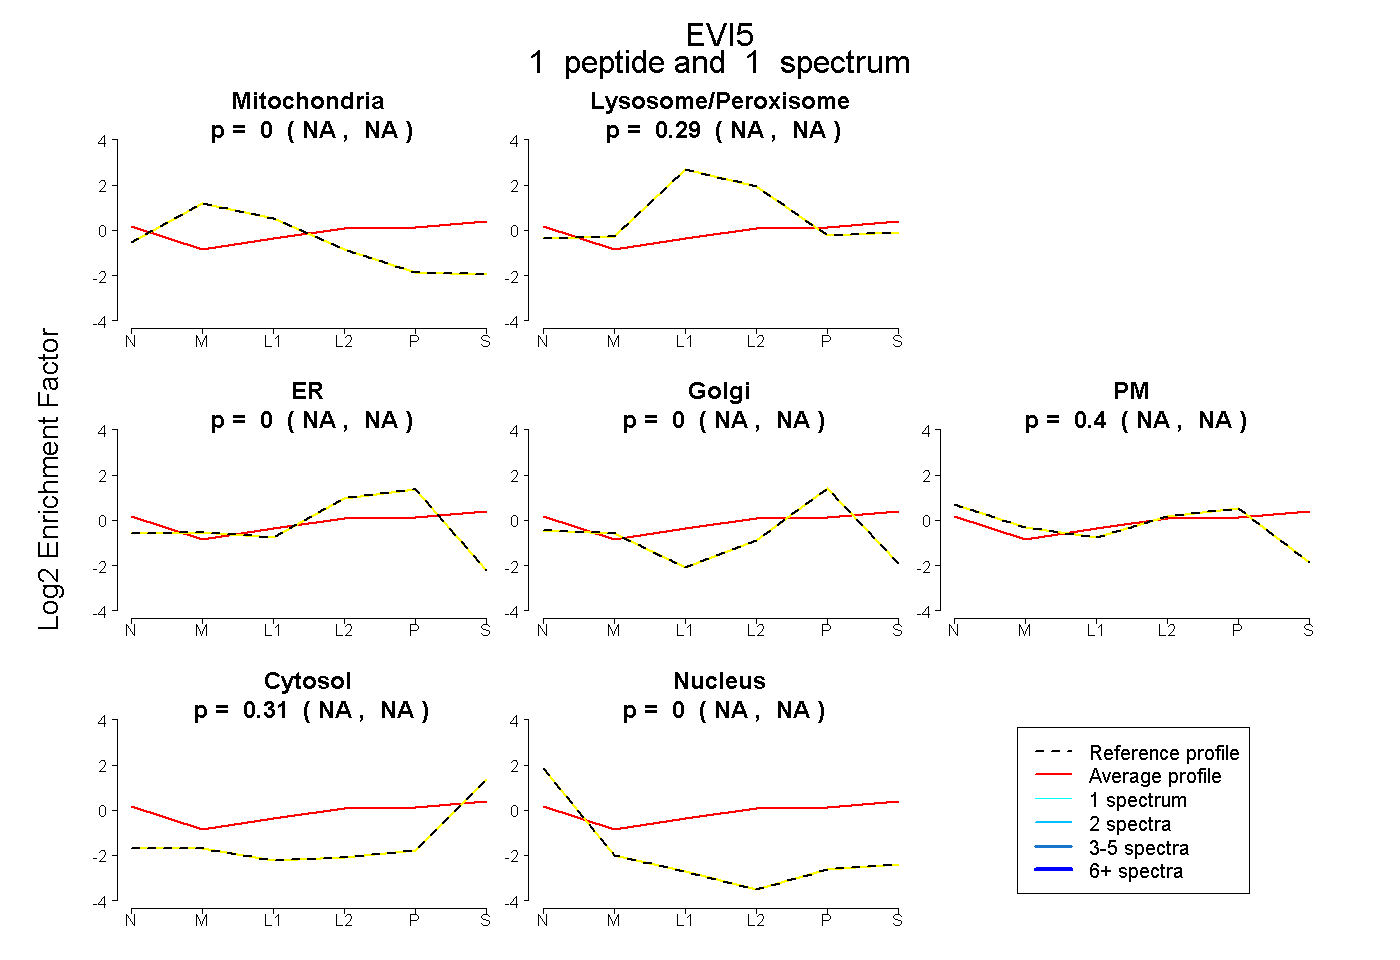
NA | NA
NA | NA
NA | NA
NA | NA
NA | NA
NA | NA
NA | NA
8peptides
spectra
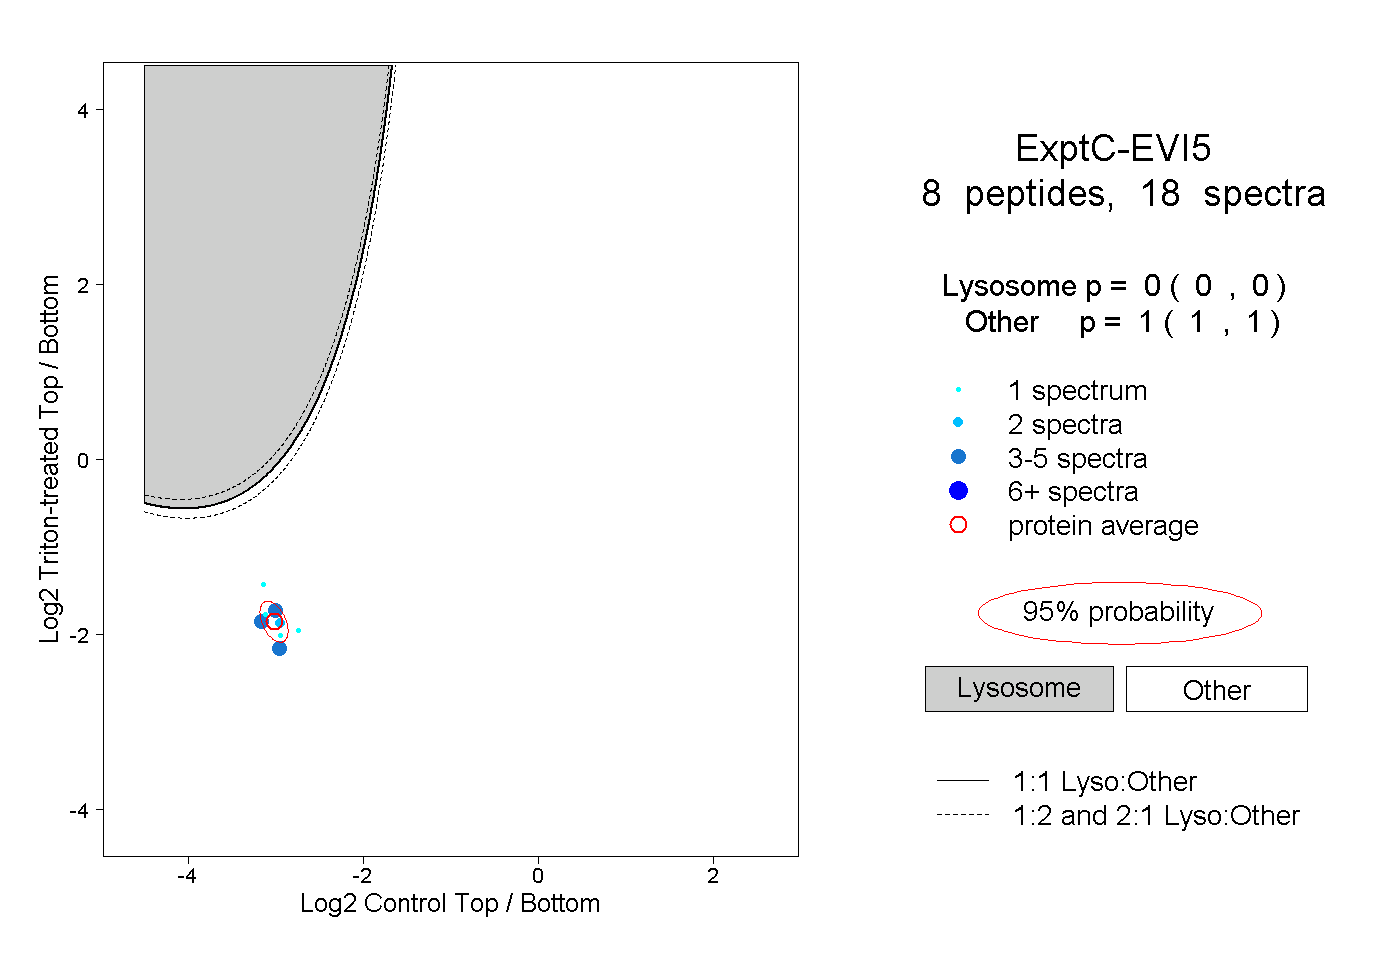
0.000 | 0.000
1.000 | 1.000