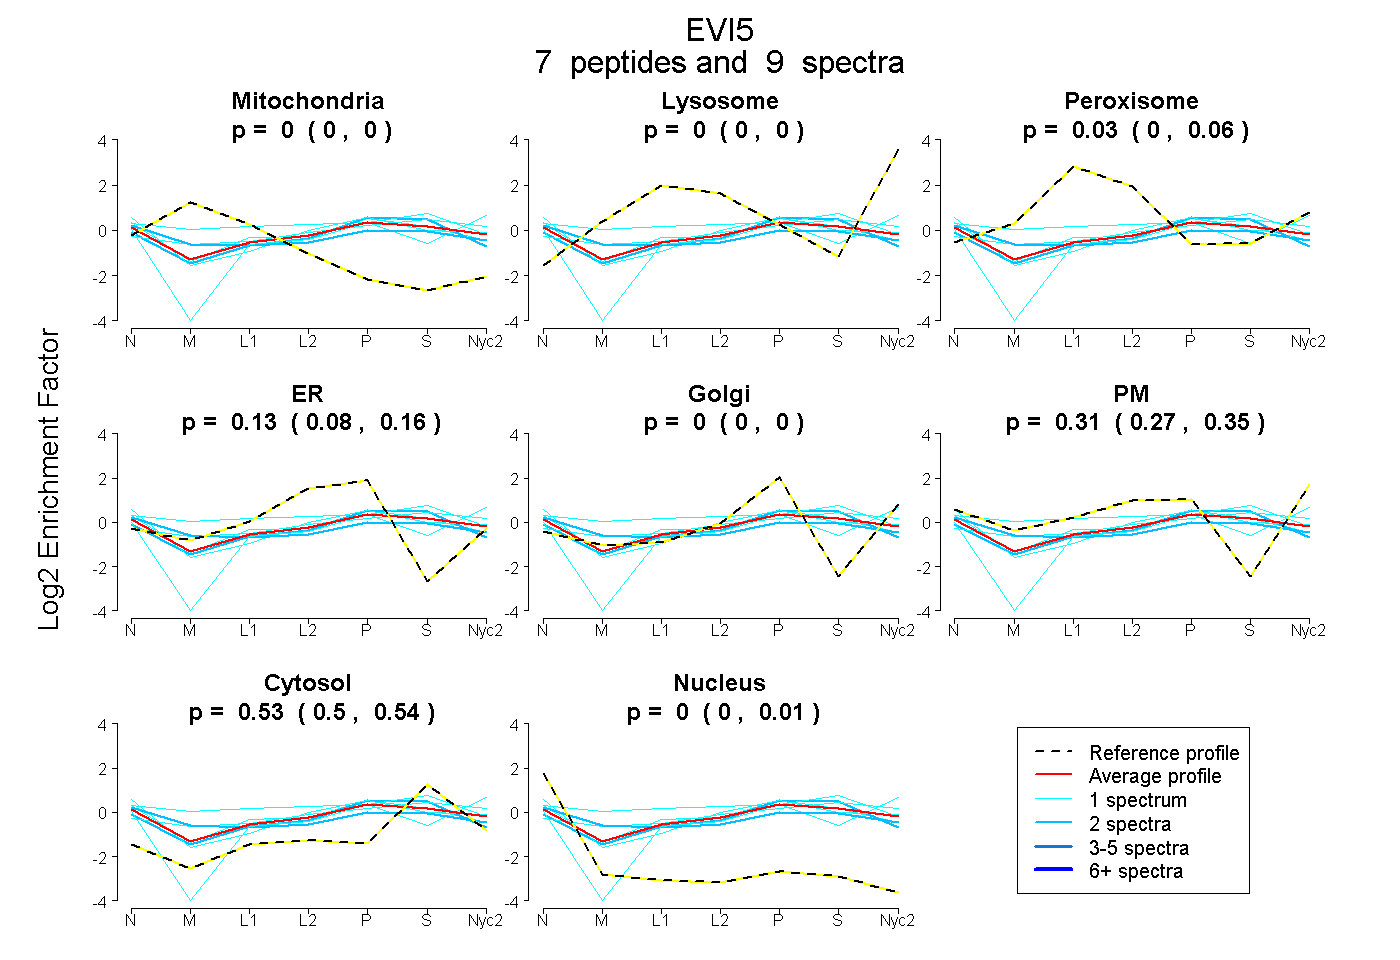
 7
7peptides
spectra
0.000 | 0.000
0.000 | 0.000
0.002 | 0.059
0.082 | 0.164
0.000 | 0.000
0.265 | 0.354
0.498 | 0.543
0.000 | 0.011
| Plot | Mito | Lyso | Perox | ER | Golgi | PM | Cytosol | Nucleus | |||||
| Expt A |
7 peptides |
9 spectra |
|
0.000 0.000 | 0.000 |
0.000 0.000 | 0.000 |
0.031 0.002 | 0.059 |
0.130 0.082 | 0.164 |
0.000 0.000 | 0.000 |
0.314 0.265 | 0.354 |
0.525 0.498 | 0.543 |
0.000 0.000 | 0.011 |
| 2 spectra, LQEELIAVK | 0.152 | 0.000 | 0.000 | 0.040 | 0.009 | 0.330 | 0.469 | 0.000 | ||
| 2 spectra, EAEAIMGLK | 0.000 | 0.000 | 0.037 | 0.291 | 0.054 | 0.042 | 0.575 | 0.000 | ||
| 1 spectrum, DSLGQEVLFNVMK | 0.064 | 0.000 | 0.189 | 0.000 | 0.000 | 0.518 | 0.229 | 0.000 | ||
| 1 spectrum, LSPDDLELLAK | 0.000 | 0.000 | 0.000 | 0.139 | 0.100 | 0.043 | 0.718 | 0.000 | ||
| 1 spectrum, AYSLVDR | 0.000 | 0.000 | 0.067 | 0.213 | 0.000 | 0.216 | 0.484 | 0.021 | ||
| 1 spectrum, IVNEWDDVR | 0.000 | 0.000 | 0.000 | 0.142 | 0.000 | 0.363 | 0.462 | 0.033 | ||
| 1 spectrum, EMEEQGEIK | 0.000 | 0.000 | 0.184 | 0.000 | 0.111 | 0.228 | 0.477 | 0.000 |
| Plot | Mito | Lyso or Perox | ER | Golgi | PM | Cytosol | Nucleus | ||||||
| Expt B |
1 peptide |
1 spectrum |
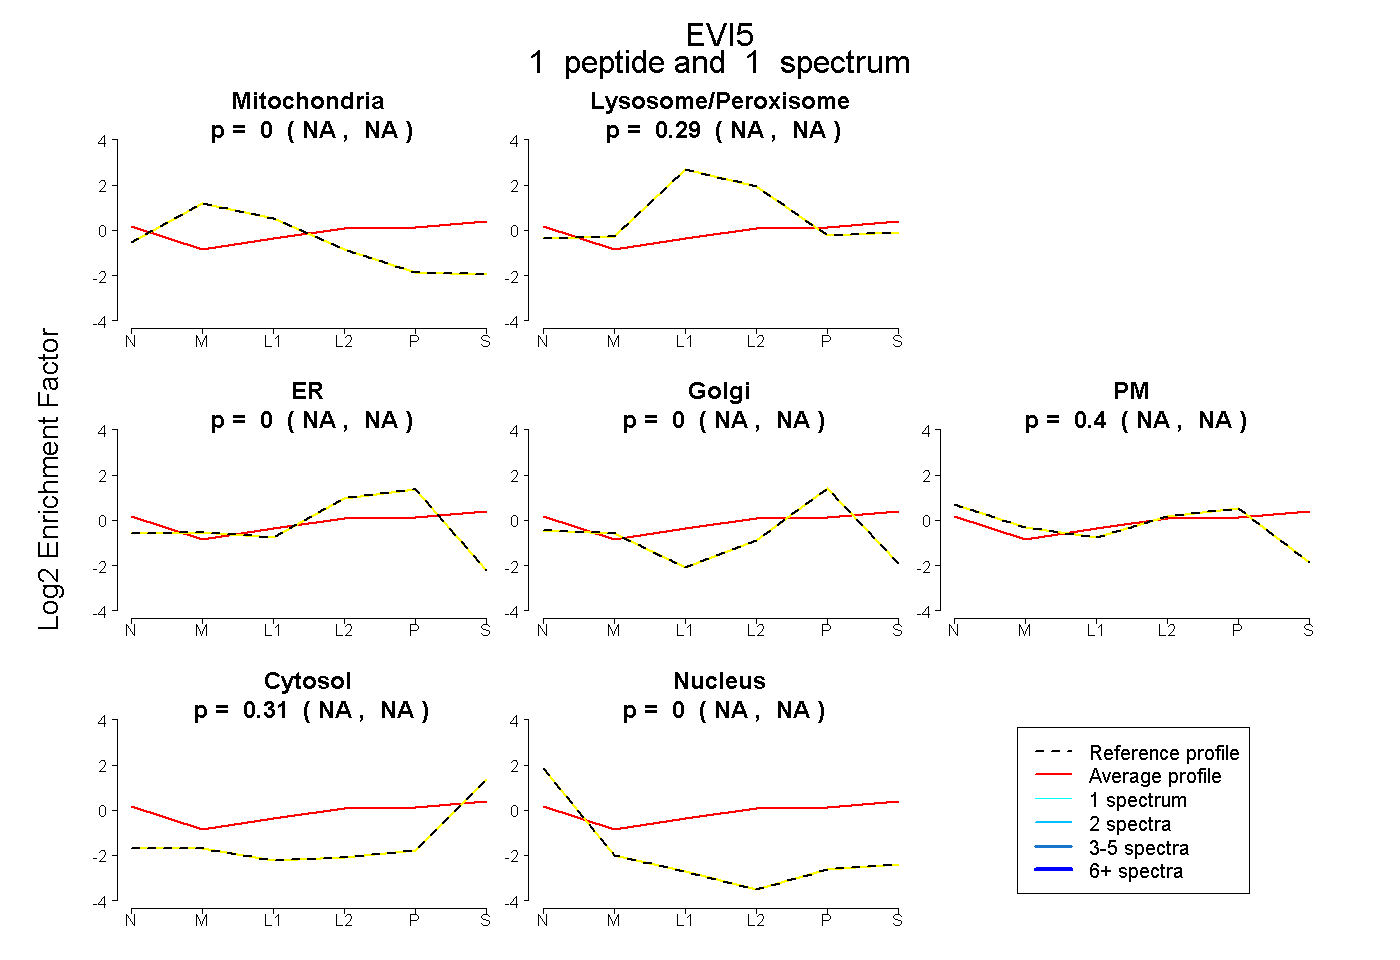 |
0.000 NA | NA |
0.290 NA | NA |
0.000 NA | NA |
0.000 NA | NA |
0.396 NA | NA |
0.314 NA | NA |
0.000 NA | NA |
|||
| Plot | Lyso | Other | |||||||||||
| Expt C |
8 peptides |
18 spectra |
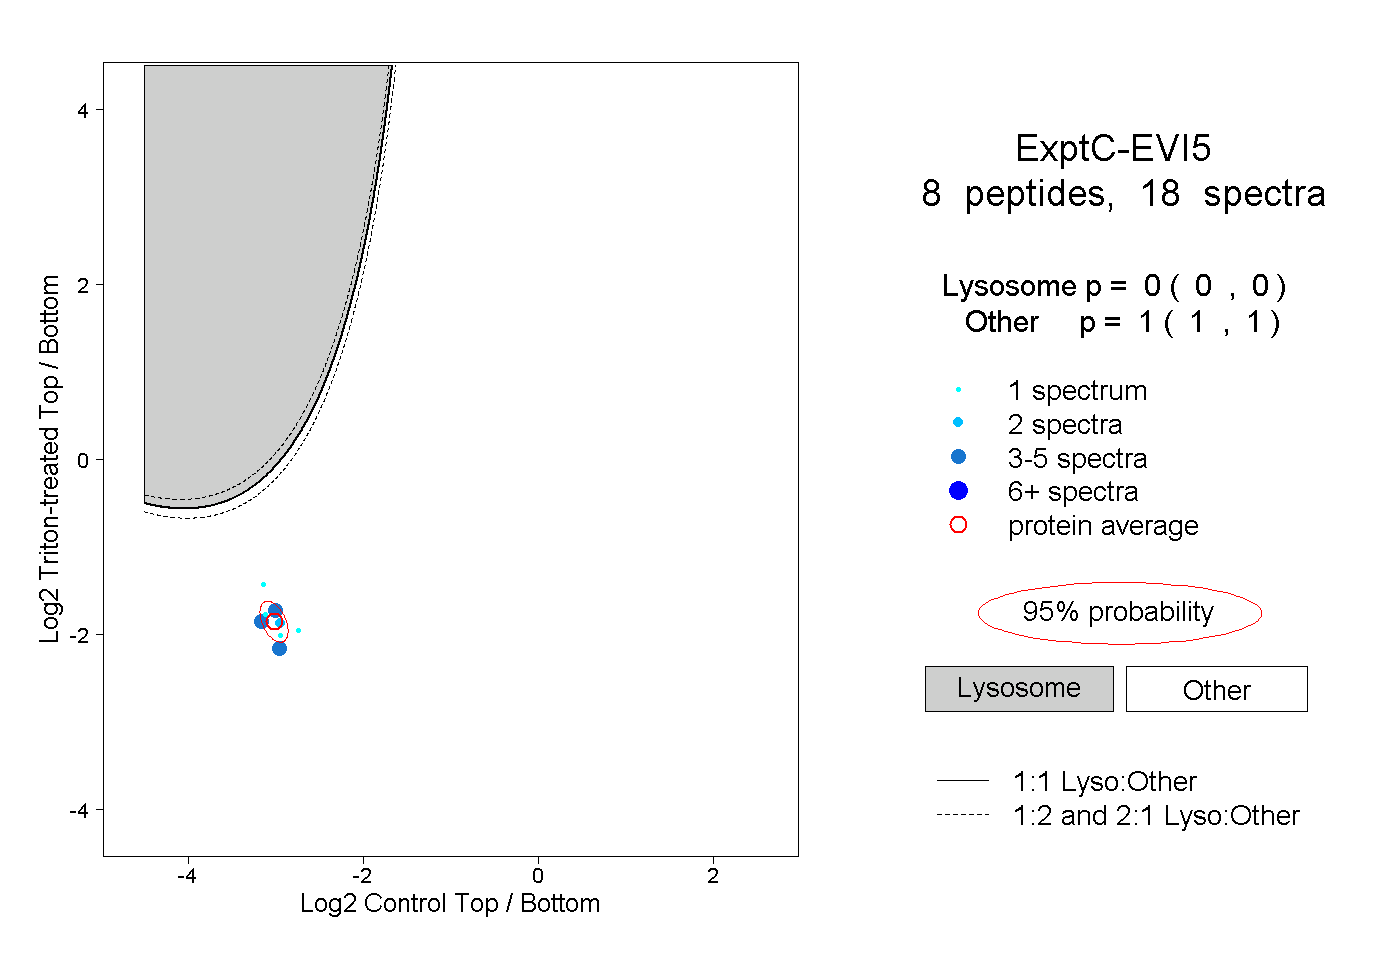 |
0.000 0.000 | 0.000 |
1.000 1.000 | 1.000 |