 2
2peptides
spectra
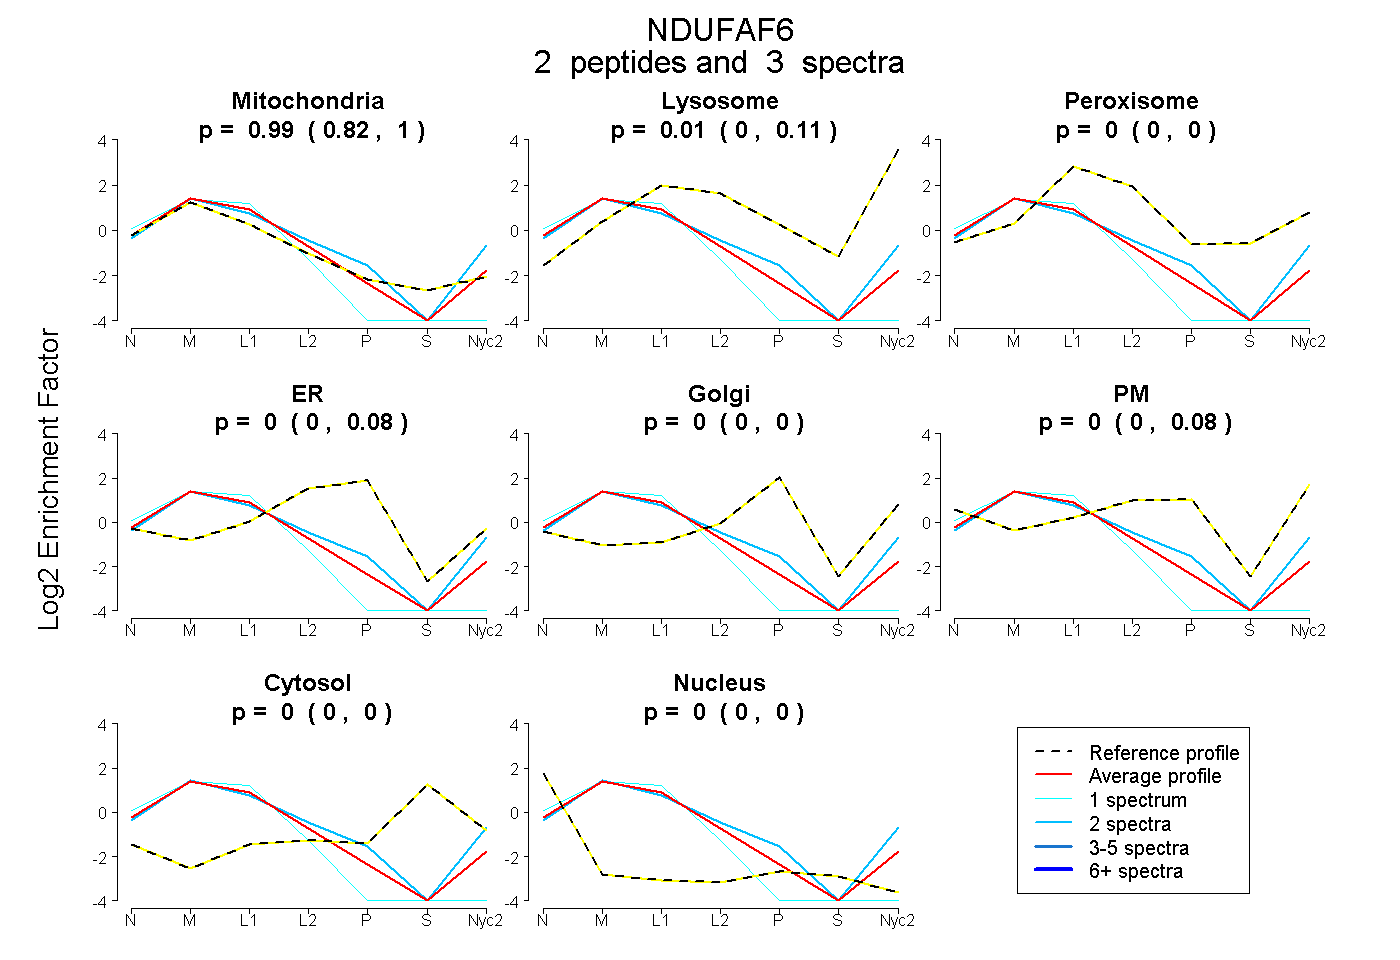
0.824 | 1.000
0.000 | 0.106
0.000 | 0.000
0.000 | 0.076
0.000 | 0.000
0.000 | 0.082
0.000 | 0.000
0.000 | 0.000
1peptide
spectrum
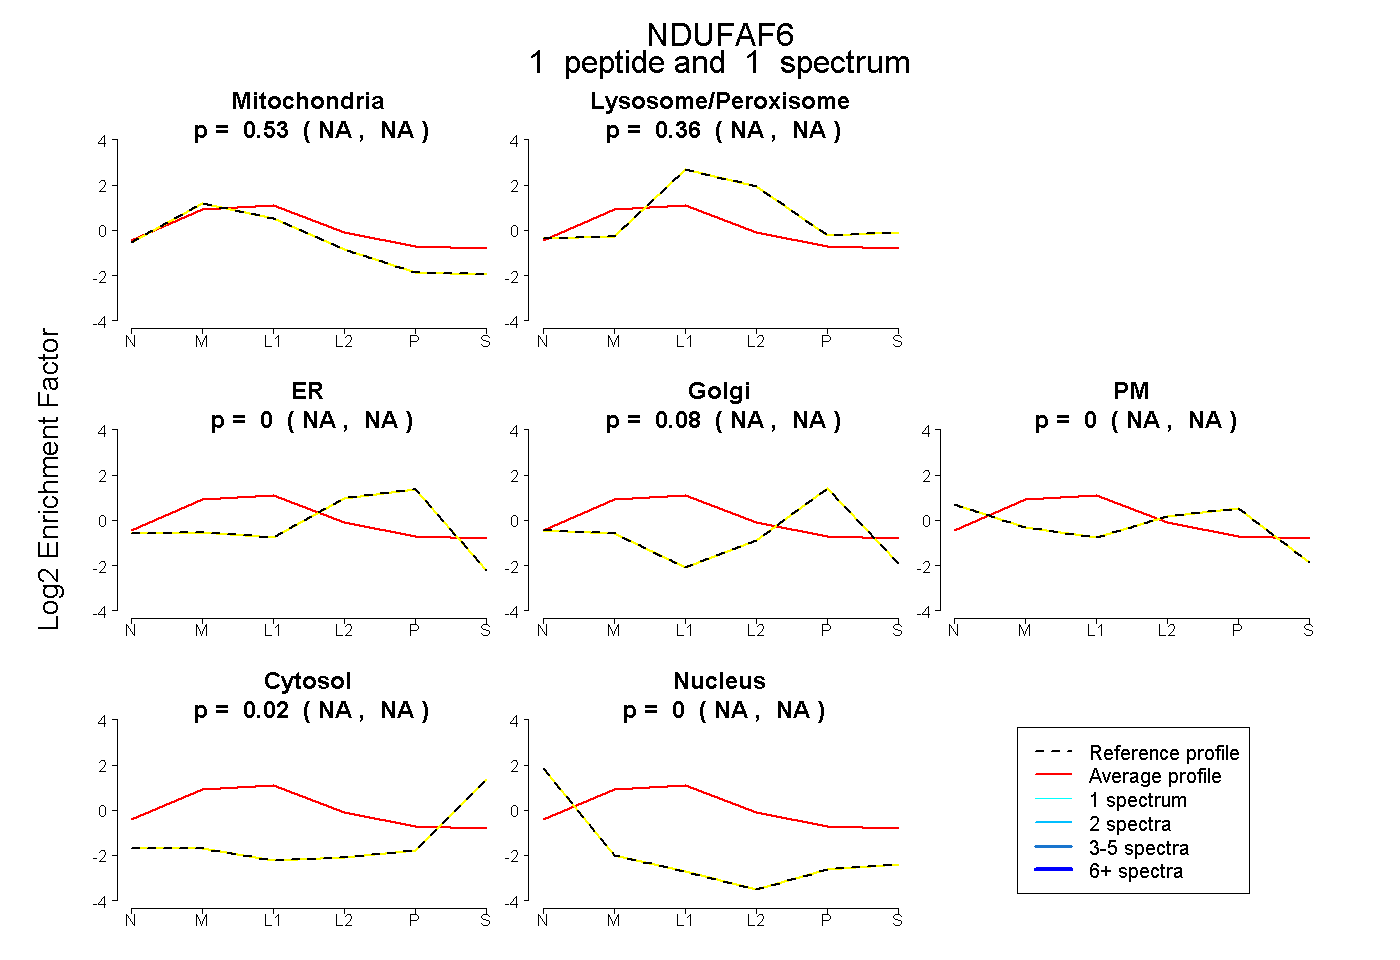
NA | NA
NA | NA
NA | NA
NA | NA
NA | NA
NA | NA
NA | NA
4peptides
spectra
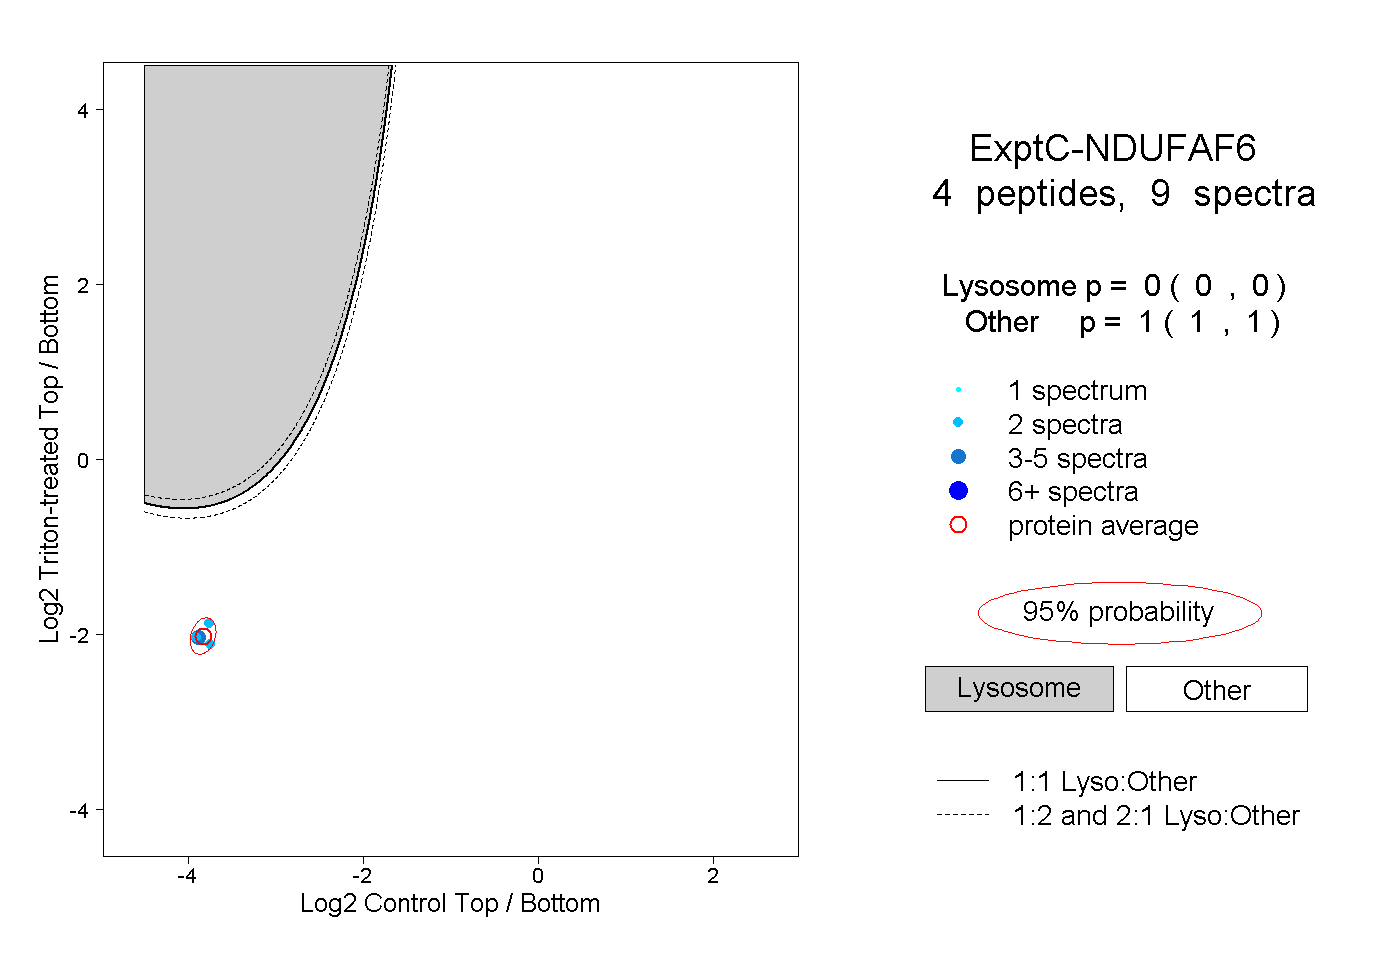
0.000 | 0.000
1.000 | 1.000
1peptide
spectra
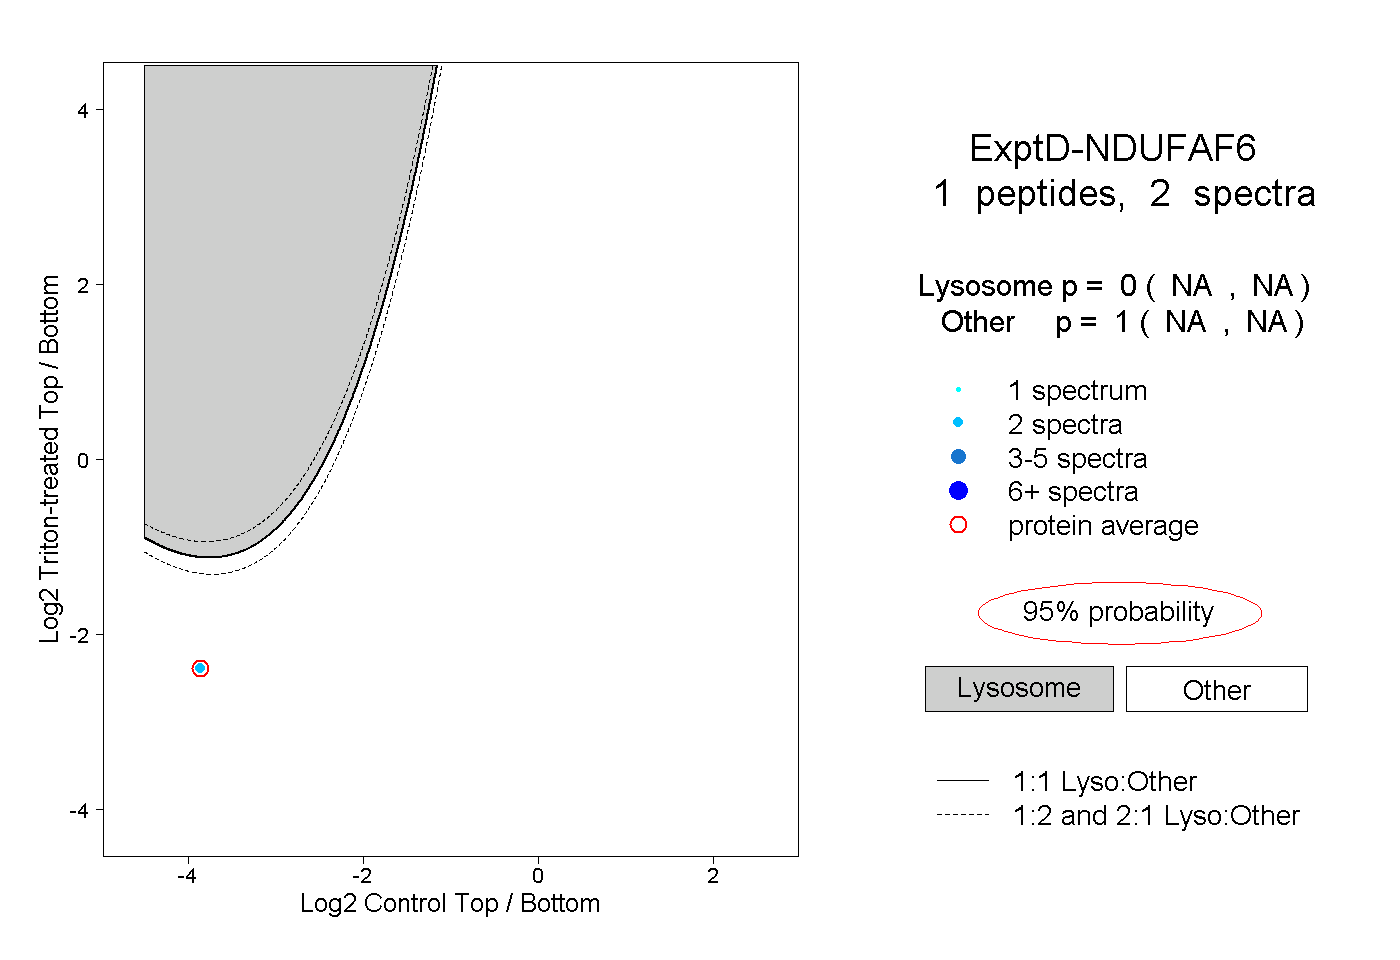
NA | NA
NA | NA