 2
2peptides
spectra
0.824 | 1.000
0.000 | 0.106
0.000 | 0.000
0.000 | 0.076
0.000 | 0.000
0.000 | 0.082
0.000 | 0.000
0.000 | 0.000
| Plot | Mito | Lyso | Perox | ER | Golgi | PM | Cytosol | Nucleus | |||||
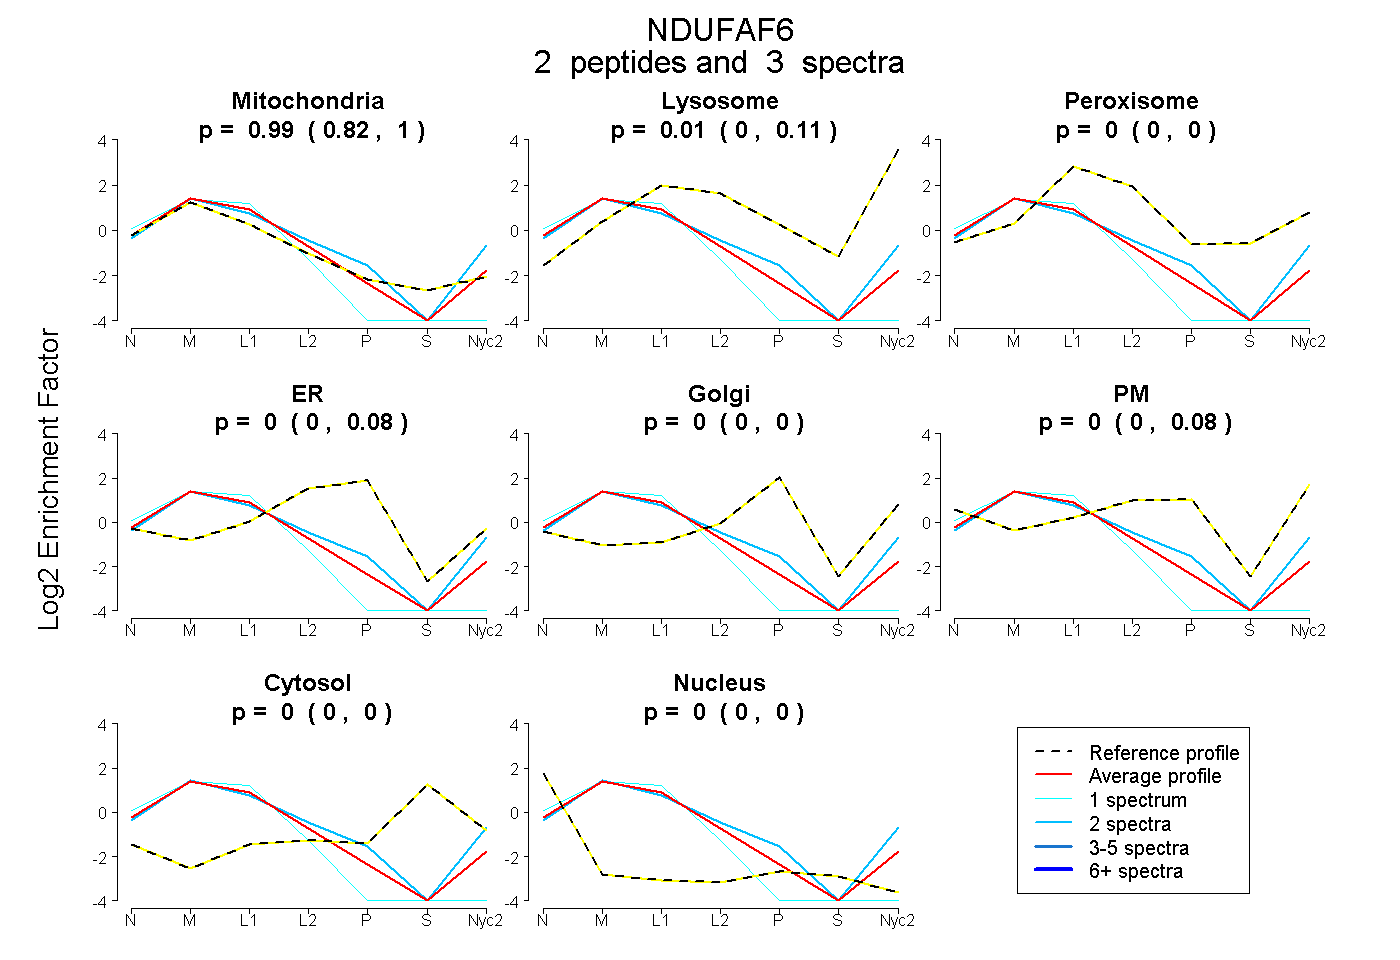
| Expt A |
2 peptides |
3 spectra |
|
0.987 0.824 | 1.000 |
0.013 0.000 | 0.106 |
0.000 0.000 | 0.000 |
0.000 0.000 | 0.076 |
0.000 0.000 | 0.000 |
0.000 0.000 | 0.082 |
0.000 0.000 | 0.000 |
0.000 0.000 | 0.000 |
| 2 spectra, MQFWR | 0.768 | 0.086 | 0.000 | 0.000 | 0.000 | 0.146 | 0.000 | 0.000 | ||
| 1 spectrum, DVVYDIASQAHLHLK | 0.953 | 0.000 | 0.000 | 0.000 | 0.000 | 0.000 | 0.000 | 0.047 |
| Plot | Mito | Lyso or Perox | ER | Golgi | PM | Cytosol | Nucleus | ||||||
| Expt B |
1 peptide |
1 spectrum |
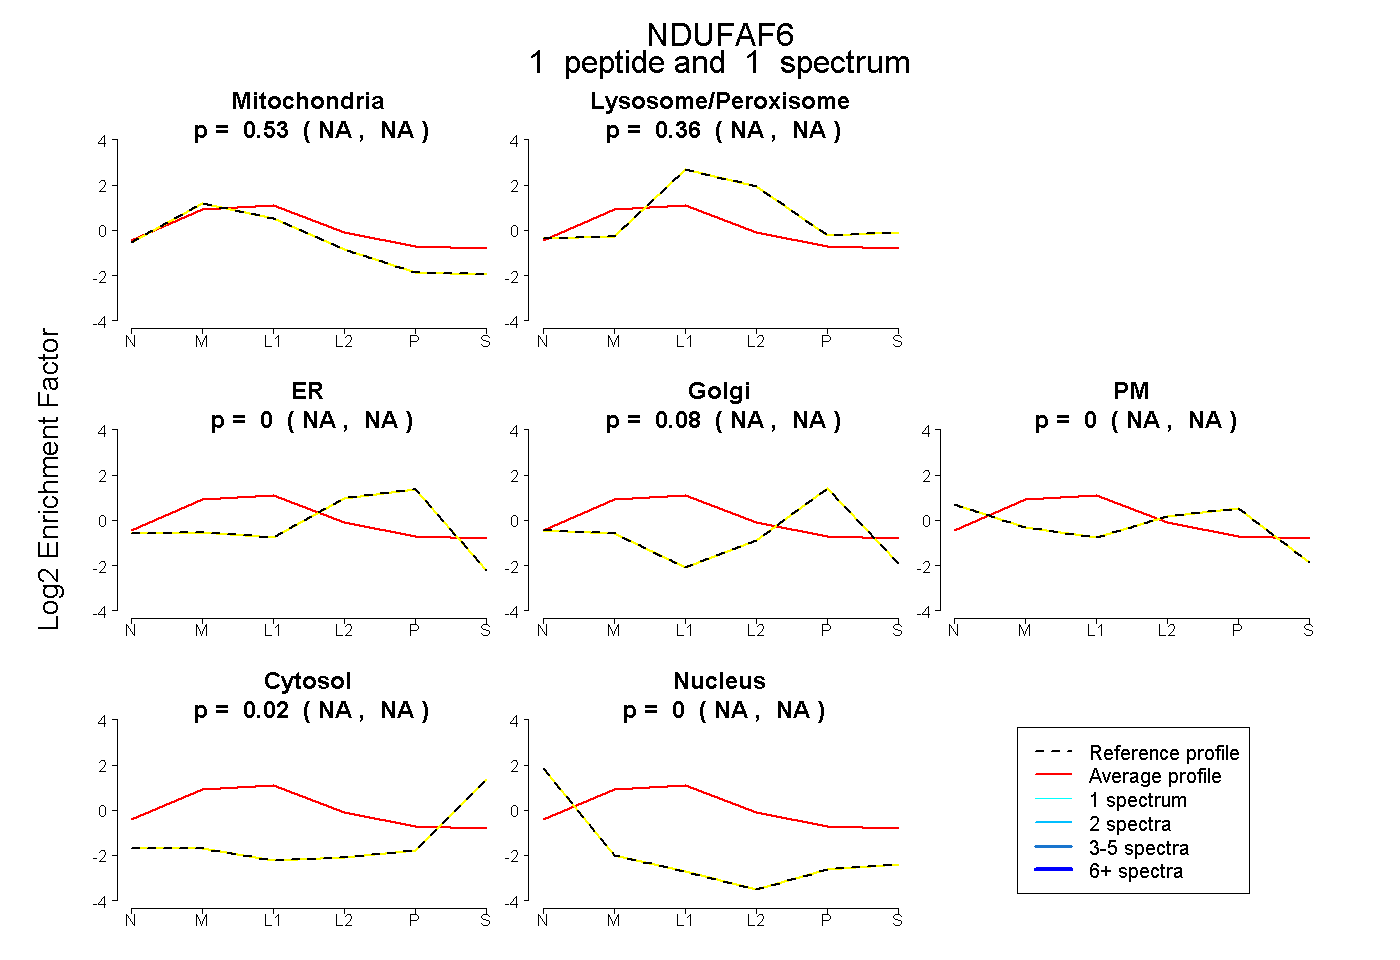 |
0.532 NA | NA |
0.362 NA | NA |
0.000 NA | NA |
0.082 NA | NA |
0.000 NA | NA |
0.025 NA | NA |
0.000 NA | NA |
|||
| Plot | Lyso | Other | |||||||||||
| Expt C |
4 peptides |
9 spectra |
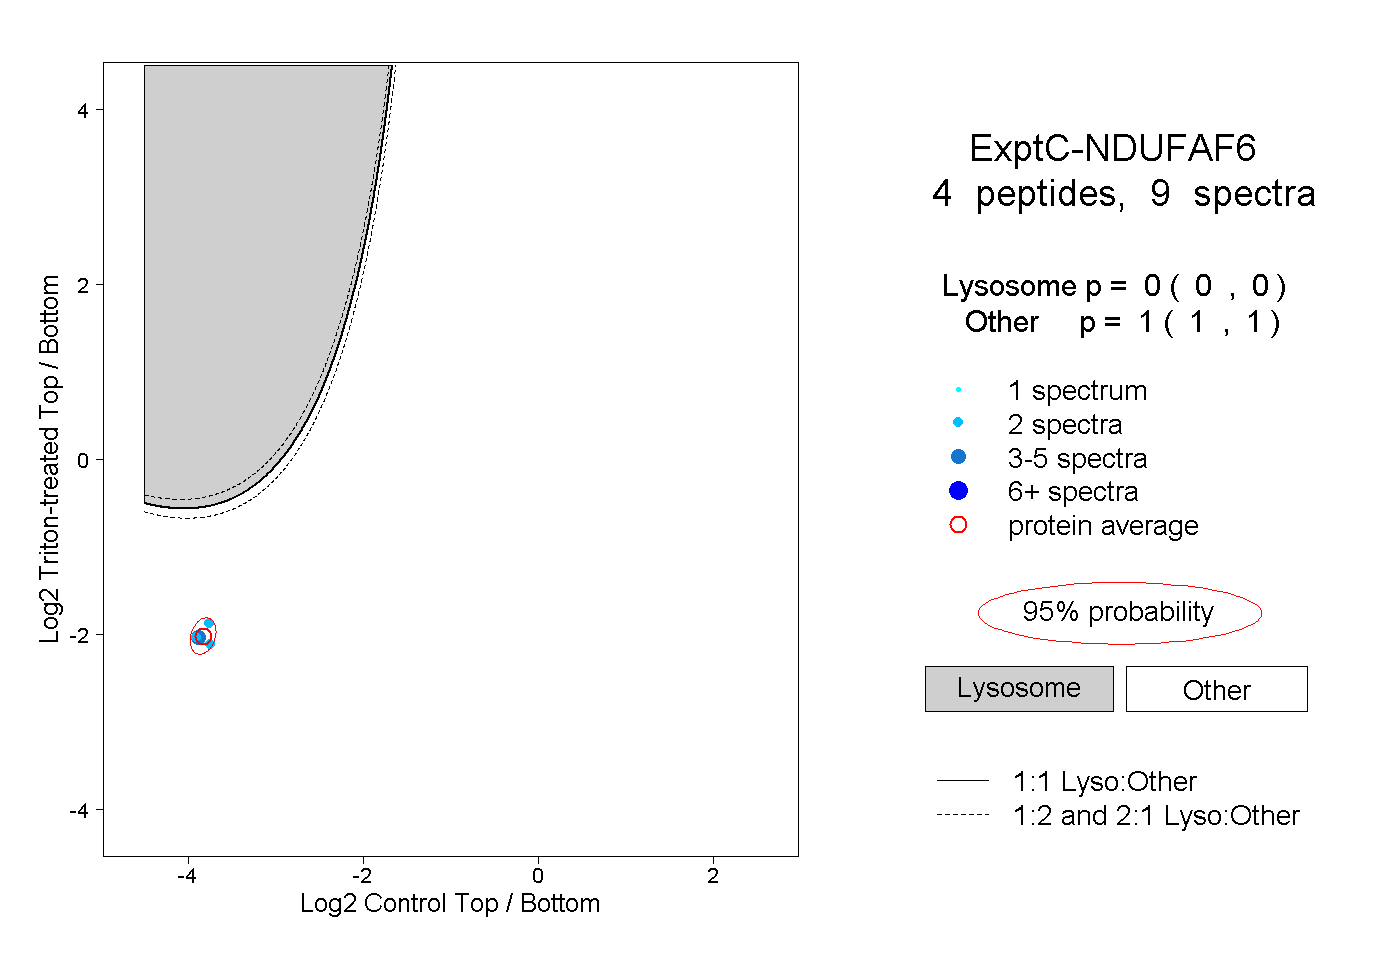 |
0.000 0.000 | 0.000 |
1.000 1.000 | 1.000 |
||||||||
| Plot | Lyso | Other | |||||||||||
| Expt D |
1 peptide |
2 spectra |
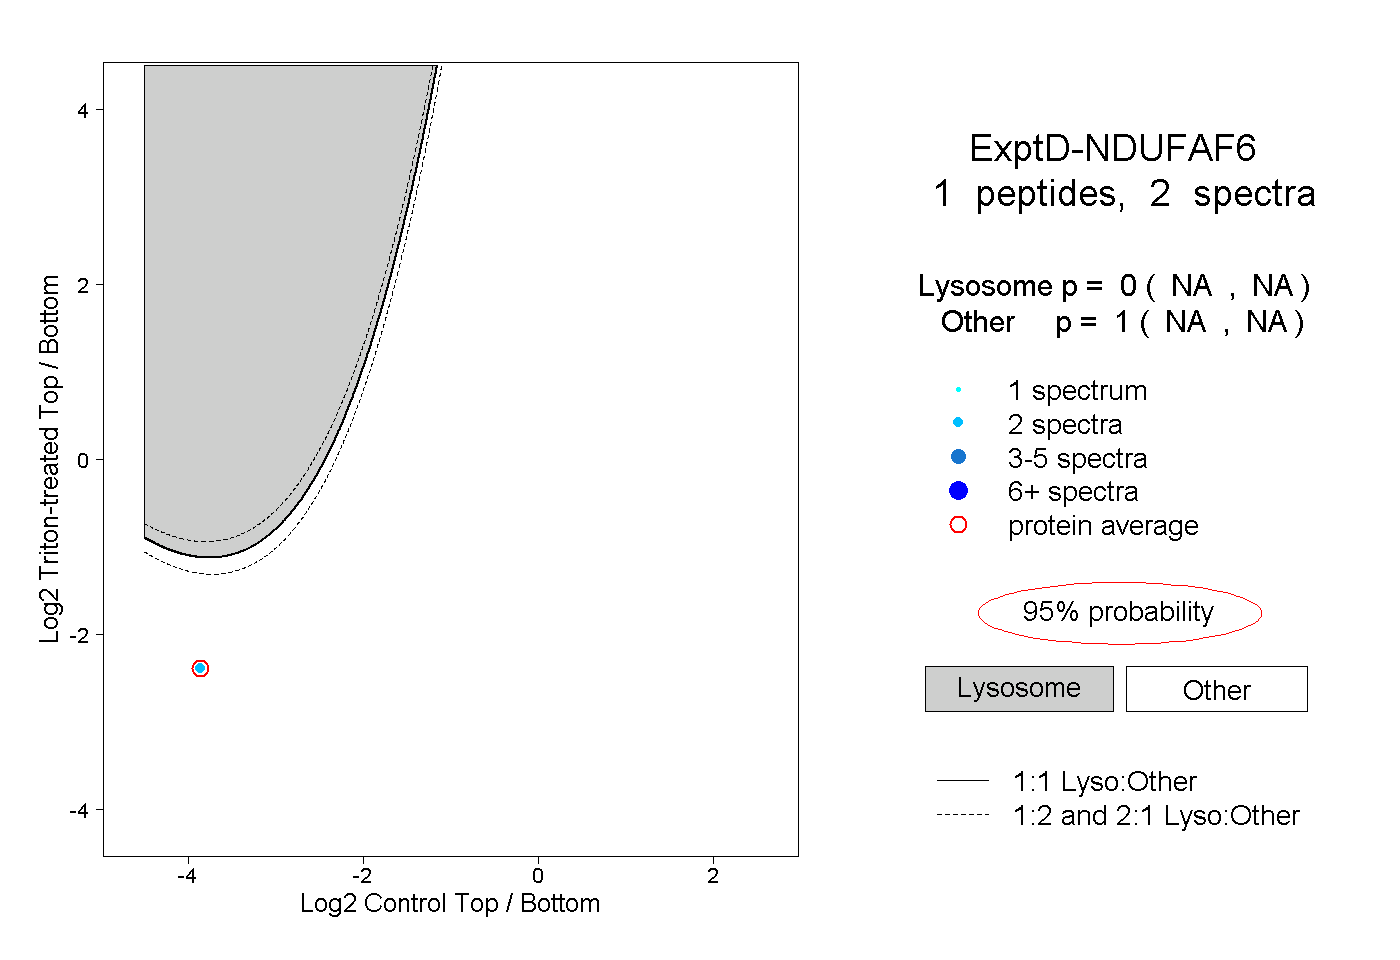 |
0.000 NA | NA |
1.000 NA | NA |