 13
13peptides
spectra
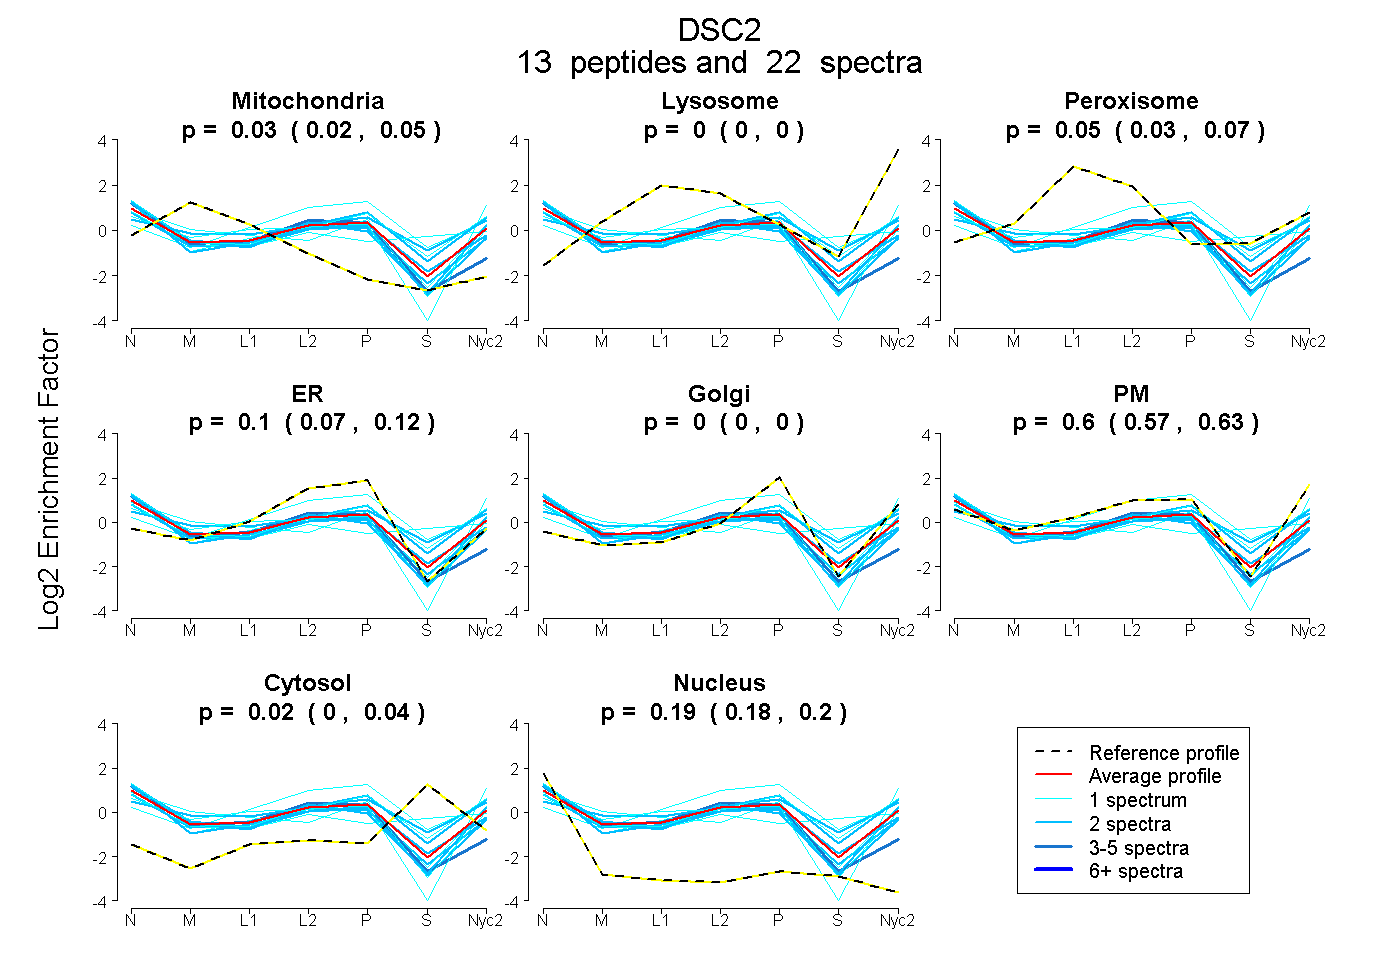
0.020 | 0.048
0.000 | 0.000
0.035 | 0.069
0.073 | 0.115
0.000 | 0.000
0.575 | 0.626
0.000 | 0.037
0.179 | 0.203
4peptides
spectra
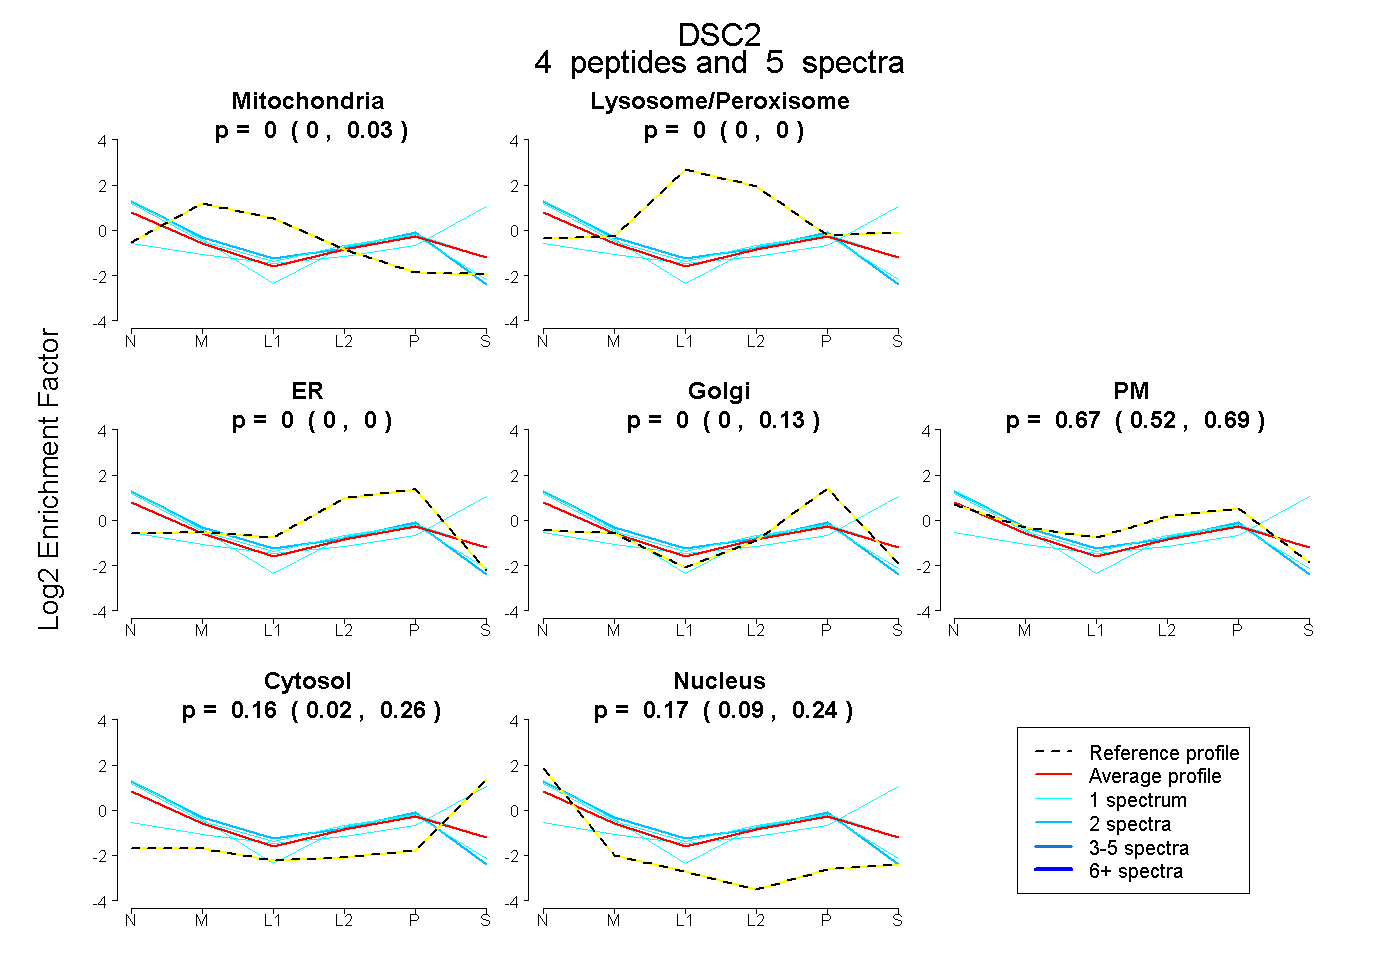
0.000 | 0.028
0.000 | 0.000
0.000 | 0.000
0.000 | 0.127
0.519 | 0.693
0.018 | 0.259
0.094 | 0.243
13peptides
spectra
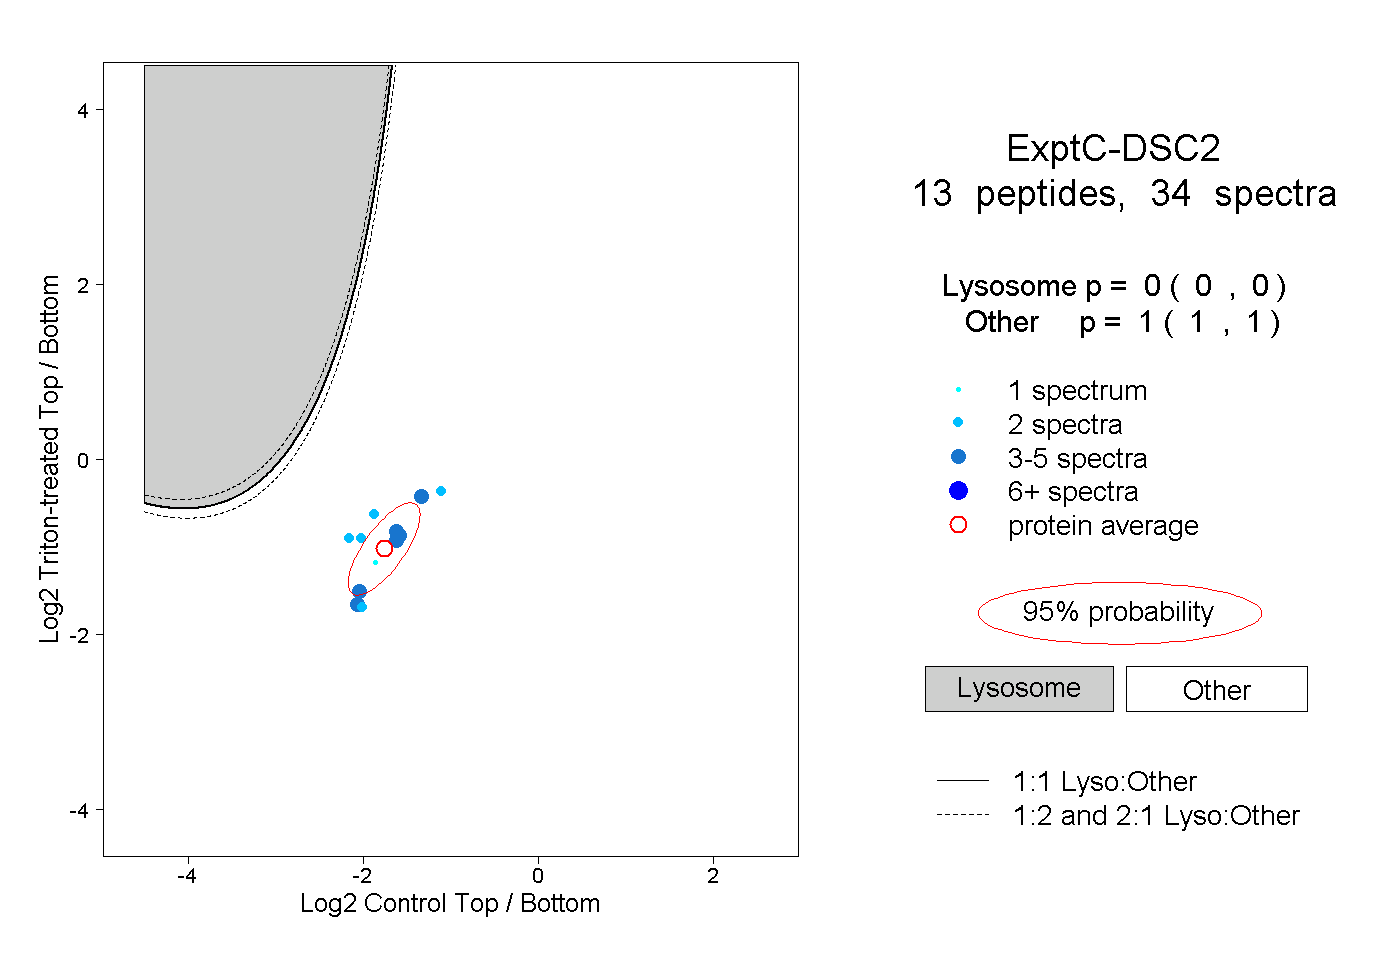
0.000 | 0.000
1.000 | 1.000
3peptides
spectra
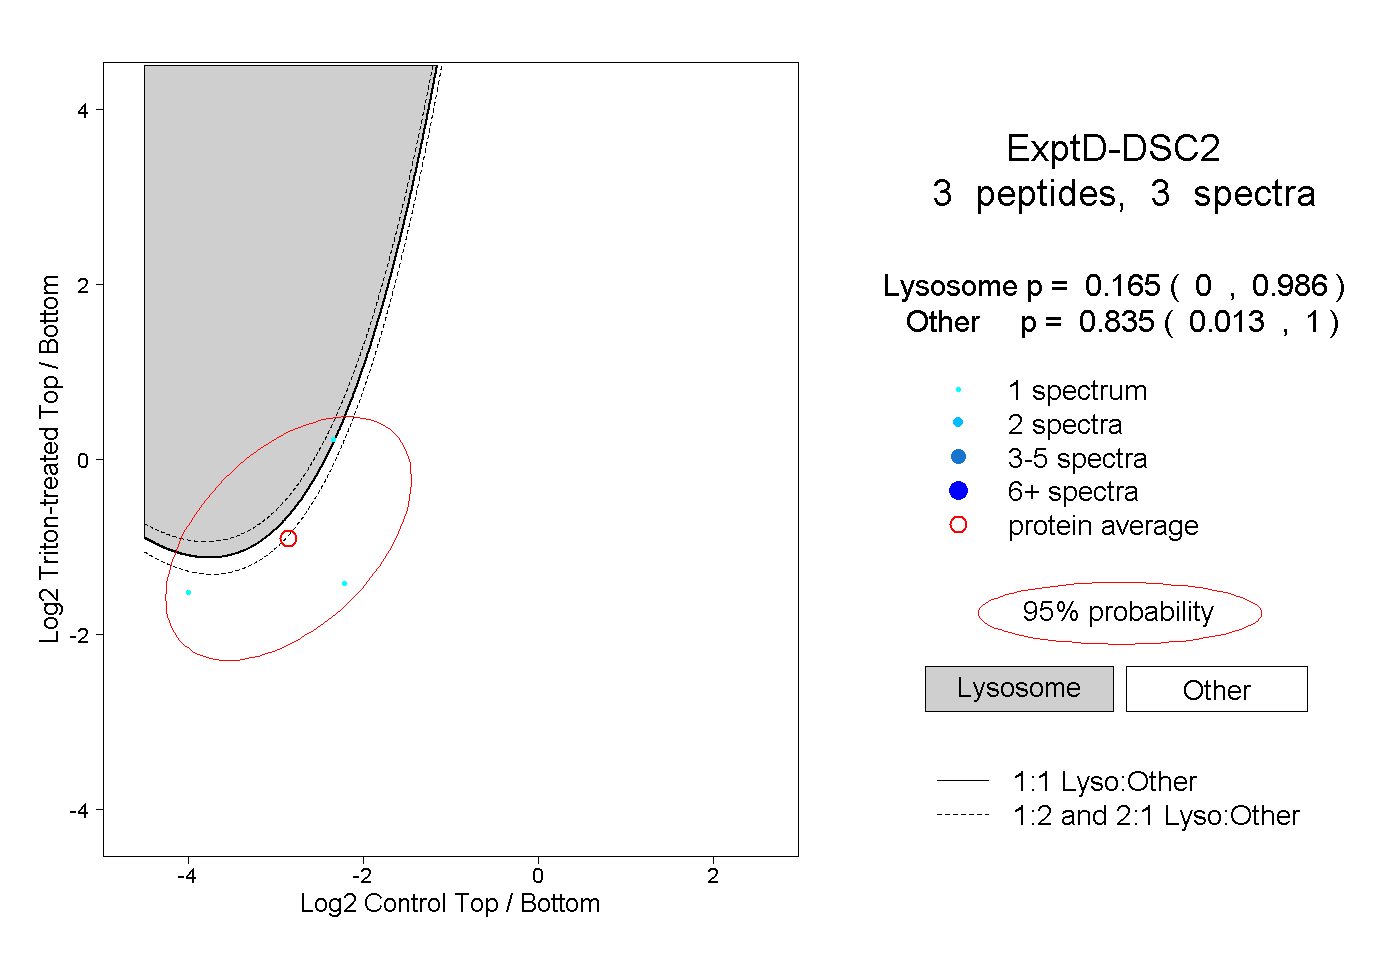
0.000 | 0.986
0.013 | 1.000