 13
13peptides
spectra
0.020 | 0.048
0.000 | 0.000
0.035 | 0.069
0.073 | 0.115
0.000 | 0.000
0.575 | 0.626
0.000 | 0.037
0.179 | 0.203
| Plot | Mito | Lyso | Perox | ER | Golgi | PM | Cytosol | Nucleus | |||||
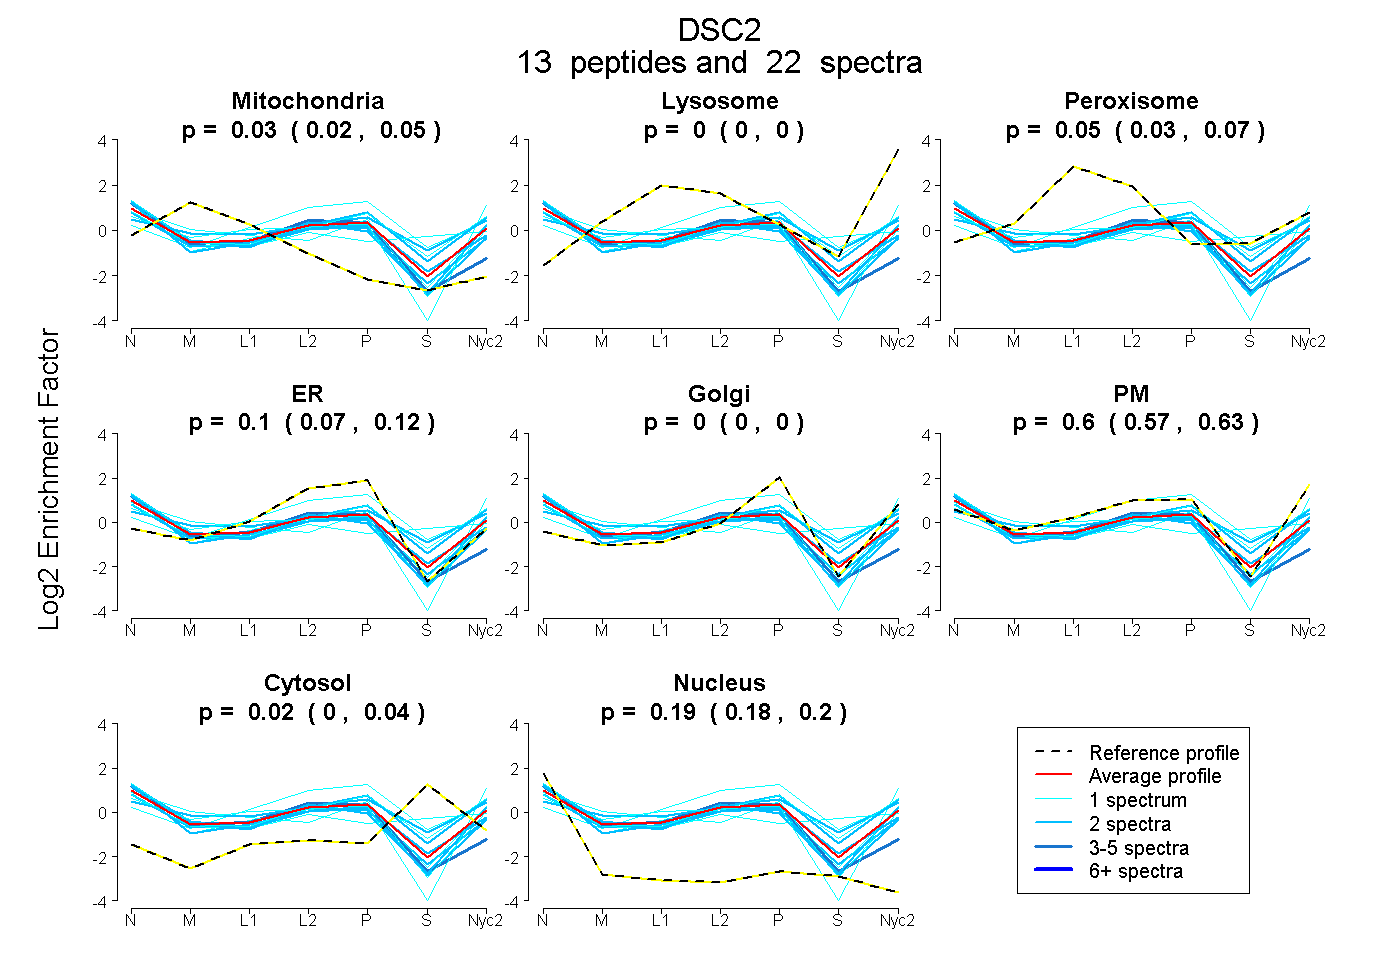
| Expt A |
13 peptides |
22 spectra |
|
0.035 0.020 | 0.048 |
0.000 0.000 | 0.000 |
0.054 0.035 | 0.069 |
0.096 0.073 | 0.115 |
0.000 0.000 | 0.000 |
0.603 0.575 | 0.626 |
0.019 0.000 | 0.037 |
0.193 0.179 | 0.203 |
| 2 spectra, VQFCHEDDNQK | 0.000 | 0.000 | 0.077 | 0.115 | 0.000 | 0.514 | 0.037 | 0.257 | ||
| 2 spectra, TGVITTTSTQLDR | 0.060 | 0.000 | 0.000 | 0.000 | 0.000 | 0.719 | 0.000 | 0.221 | ||
| 1 spectrum, GNENGNFK | 0.005 | 0.000 | 0.156 | 0.000 | 0.000 | 0.378 | 0.322 | 0.139 | ||
| 2 spectra, DTGNLYCTDR | 0.104 | 0.000 | 0.000 | 0.124 | 0.000 | 0.545 | 0.000 | 0.226 | ||
| 2 spectra, YSILEQSPSPPMLFTMHPR | 0.116 | 0.000 | 0.018 | 0.000 | 0.124 | 0.596 | 0.146 | 0.000 | ||
| 1 spectrum, ATGYHHHTMDPGR | 0.000 | 0.000 | 0.134 | 0.350 | 0.000 | 0.320 | 0.196 | 0.000 | ||
| 2 spectra, ENVPIGTR | 0.000 | 0.000 | 0.000 | 0.029 | 0.000 | 0.655 | 0.257 | 0.059 | ||
| 1 spectrum, GGHVEVDNYR | 0.000 | 0.000 | 0.007 | 0.039 | 0.000 | 0.725 | 0.000 | 0.229 | ||
| 1 spectrum, YQLLLK | 0.000 | 0.000 | 0.000 | 0.000 | 0.000 | 0.821 | 0.000 | 0.179 | ||
| 1 spectrum, YTYSEWHNFTQPR | 0.061 | 0.000 | 0.069 | 0.000 | 0.068 | 0.615 | 0.172 | 0.014 | ||
| 4 spectra, QTVVICR | 0.138 | 0.000 | 0.000 | 0.488 | 0.000 | 0.161 | 0.000 | 0.213 | ||
| 1 spectrum, STGQETIEMVK | 0.233 | 0.000 | 0.000 | 0.000 | 0.145 | 0.515 | 0.000 | 0.107 | ||
| 2 spectra, EAETLR | 0.056 | 0.000 | 0.015 | 0.130 | 0.000 | 0.545 | 0.000 | 0.254 |
| Plot | Mito | Lyso or Perox | ER | Golgi | PM | Cytosol | Nucleus | ||||||
| Expt B |
4 peptides |
5 spectra |
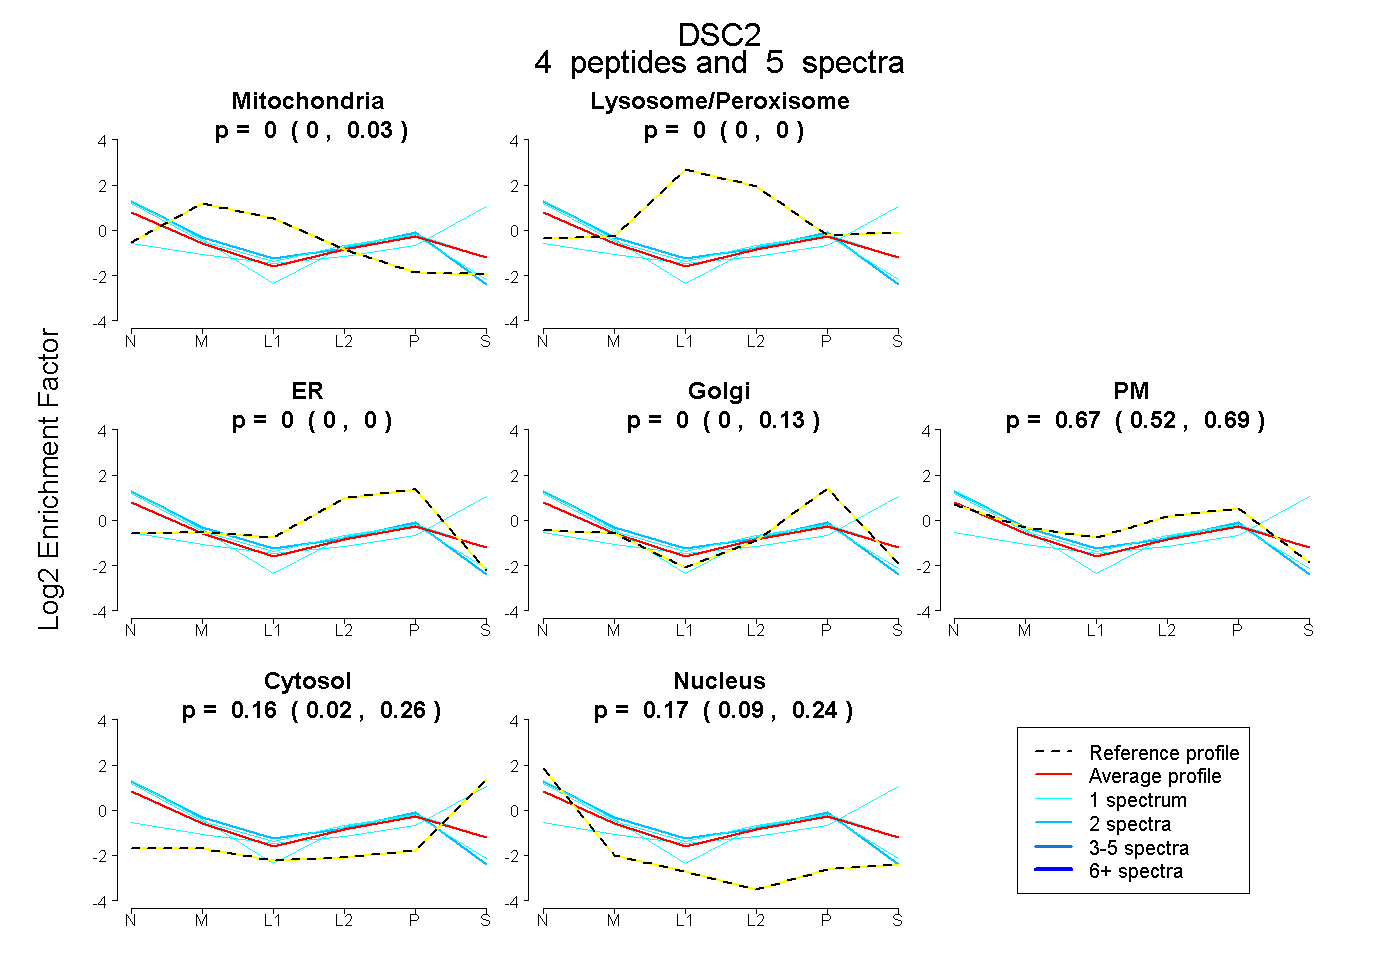 |
0.000 0.000 | 0.028 |
0.000 0.000 | 0.000 |
0.000 0.000 | 0.000 |
0.003 0.000 | 0.127 |
0.666 0.519 | 0.693 |
0.158 0.018 | 0.259 |
0.173 0.094 | 0.243 |
|||
| Plot | Lyso | Other | |||||||||||
| Expt C |
13 peptides |
34 spectra |
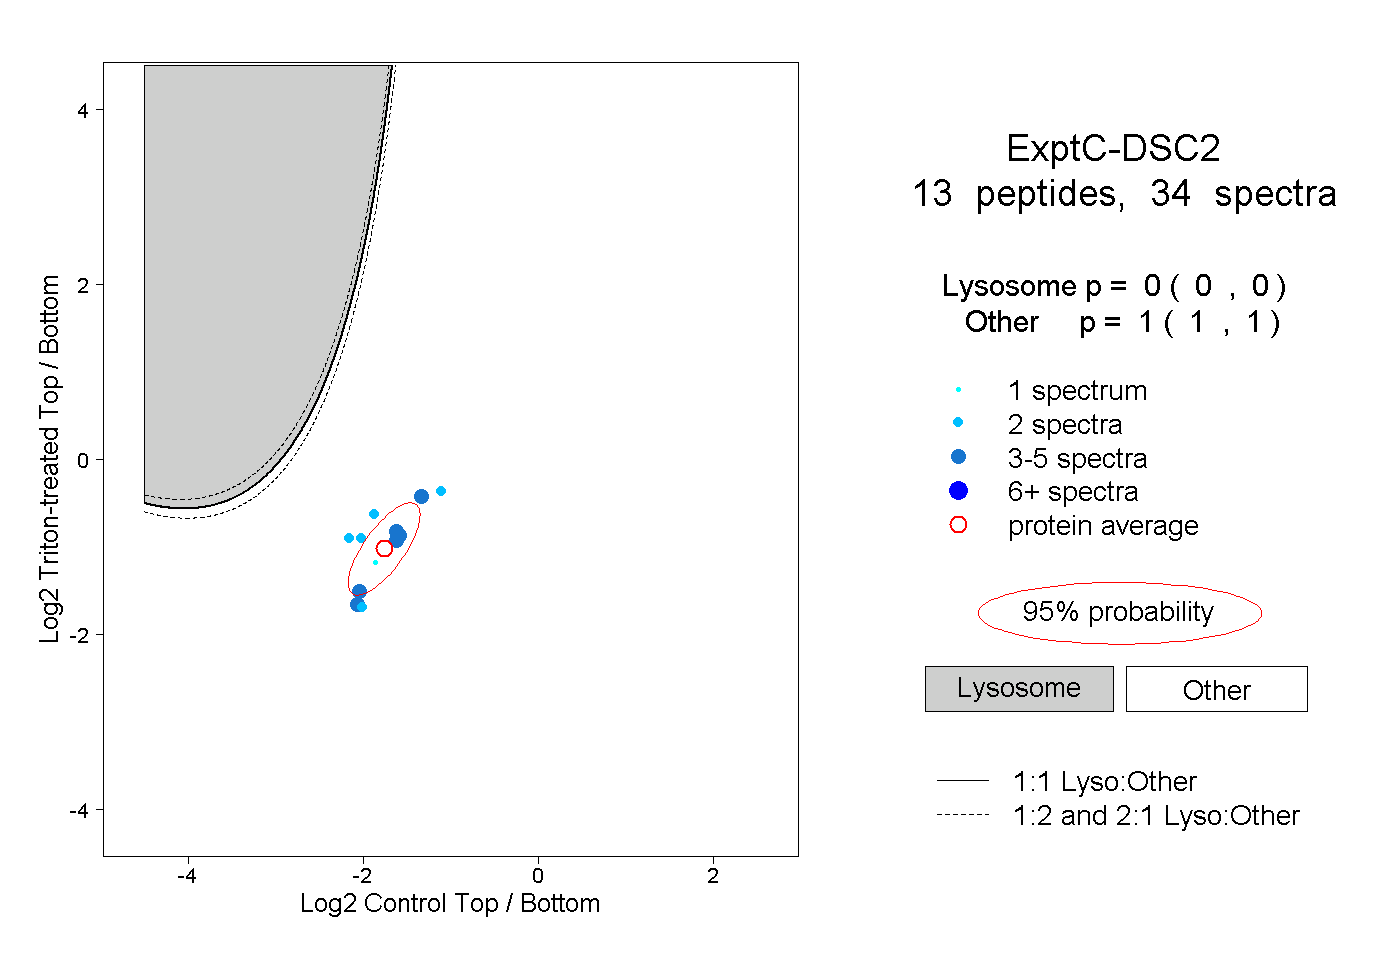 |
0.000 0.000 | 0.000 |
1.000 1.000 | 1.000 |
||||||||
| Plot | Lyso | Other | |||||||||||
| Expt D |
3 peptides |
3 spectra |
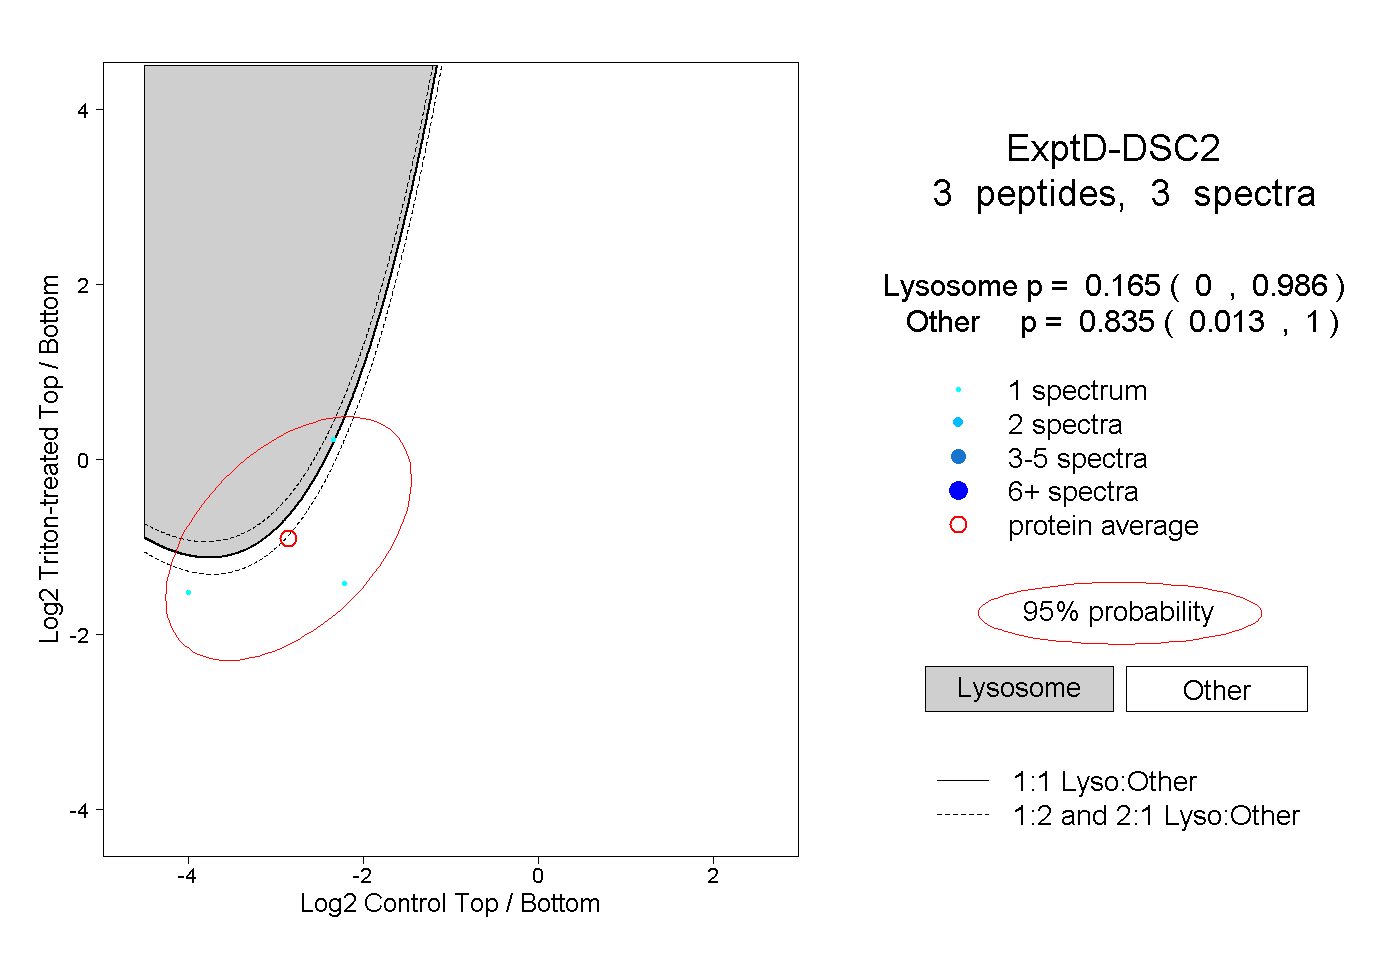 |
0.165 0.000 | 0.986 |
0.835 0.013 | 1.000 |