 6
6peptides
spectra
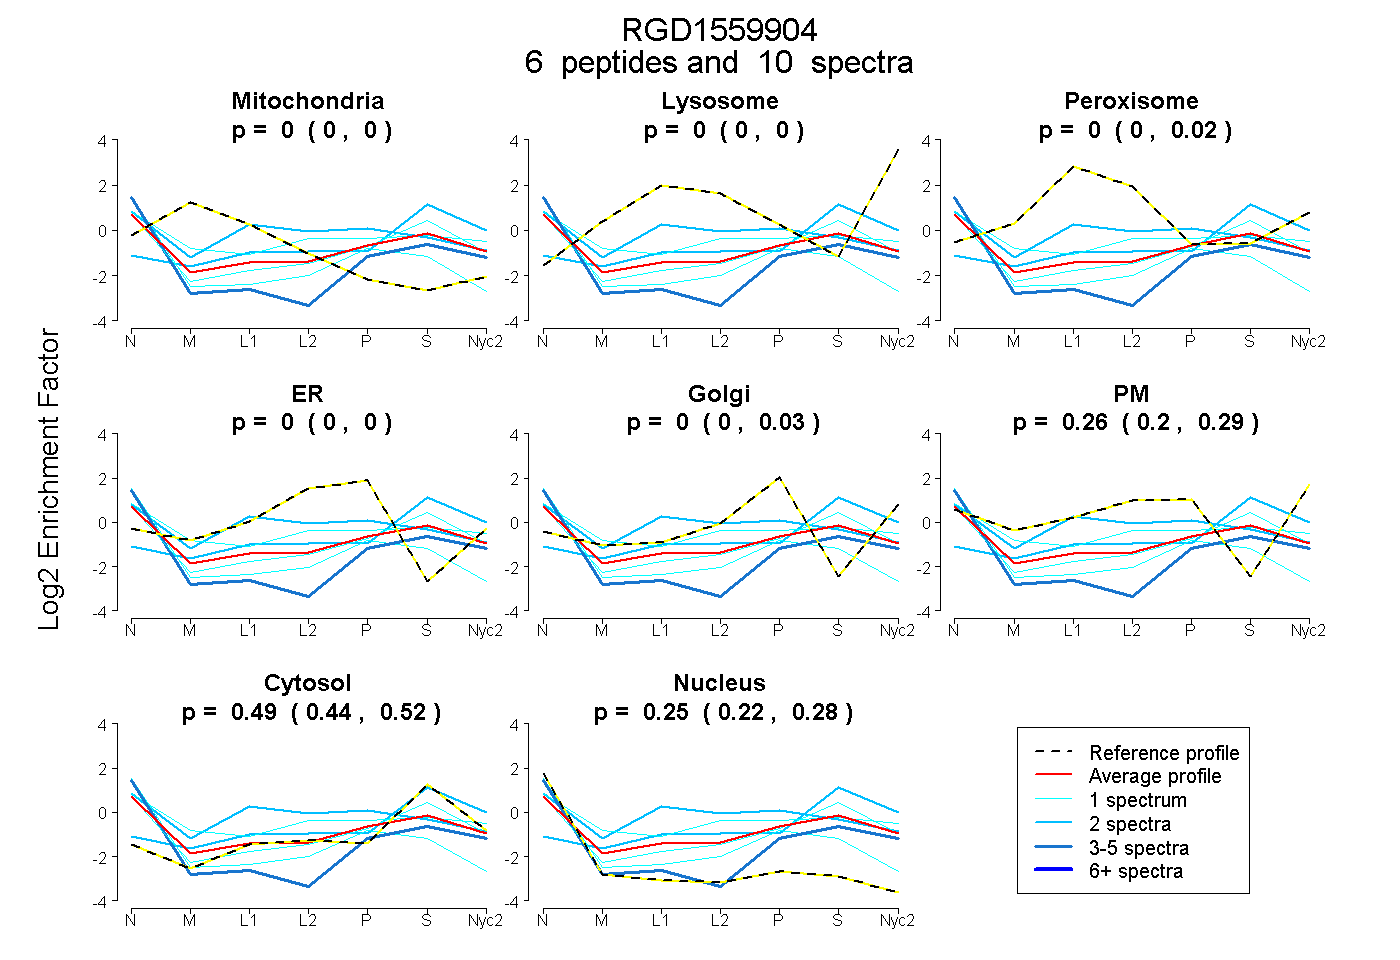
0.000 | 0.000
0.000 | 0.000
0.000 | 0.021
0.000 | 0.000
0.000 | 0.030
0.198 | 0.288
0.439 | 0.523
0.219 | 0.283
2peptides
spectra
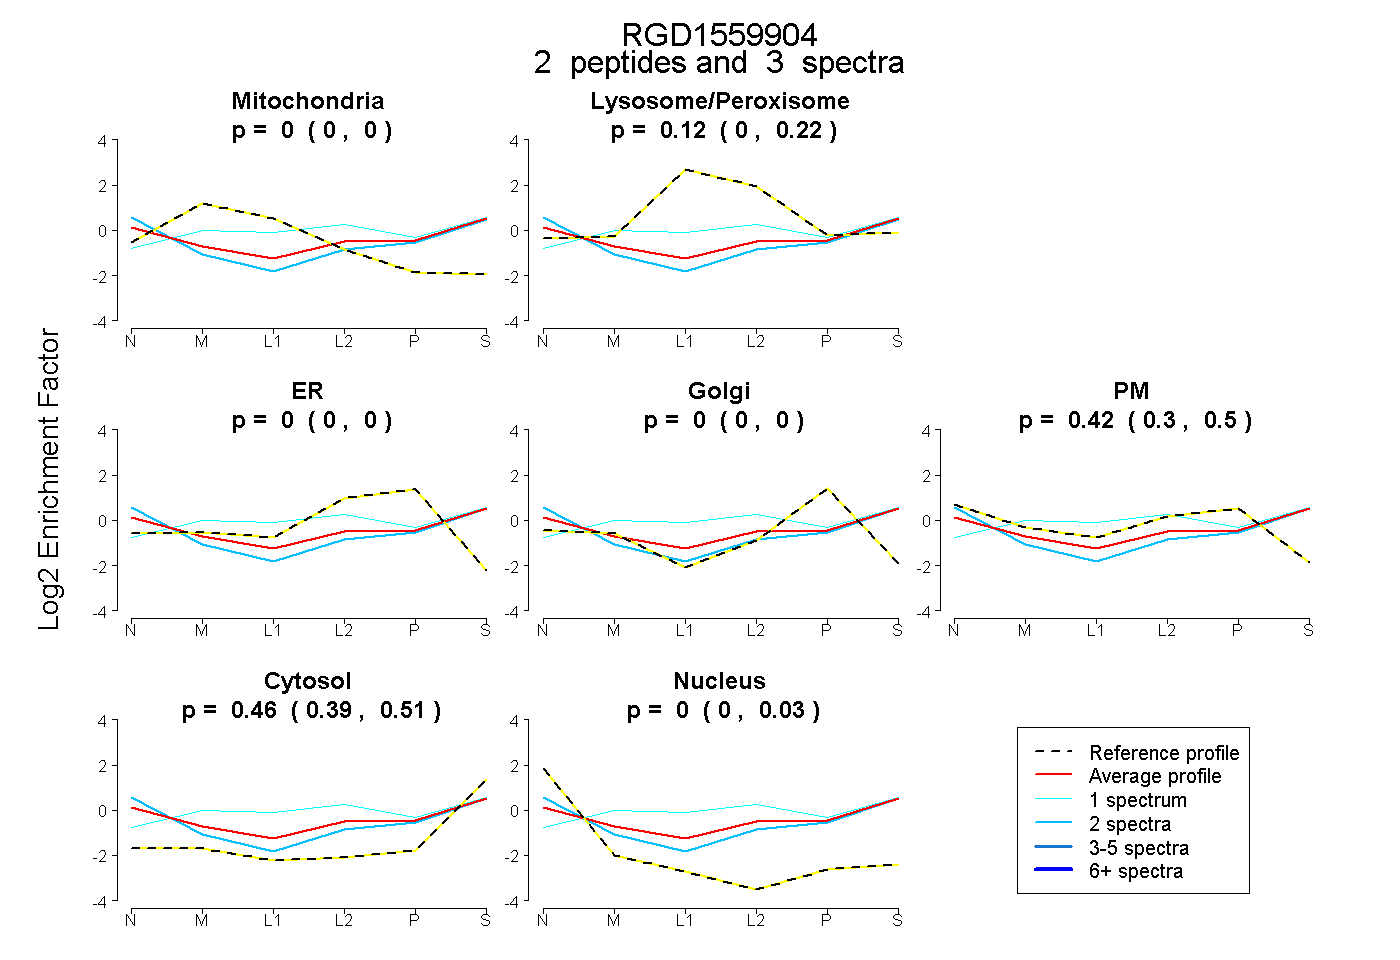
0.000 | 0.000
0.000 | 0.224
0.000 | 0.000
0.000 | 0.000
0.301 | 0.503
0.388 | 0.513
0.000 | 0.030
1peptide
spectrum
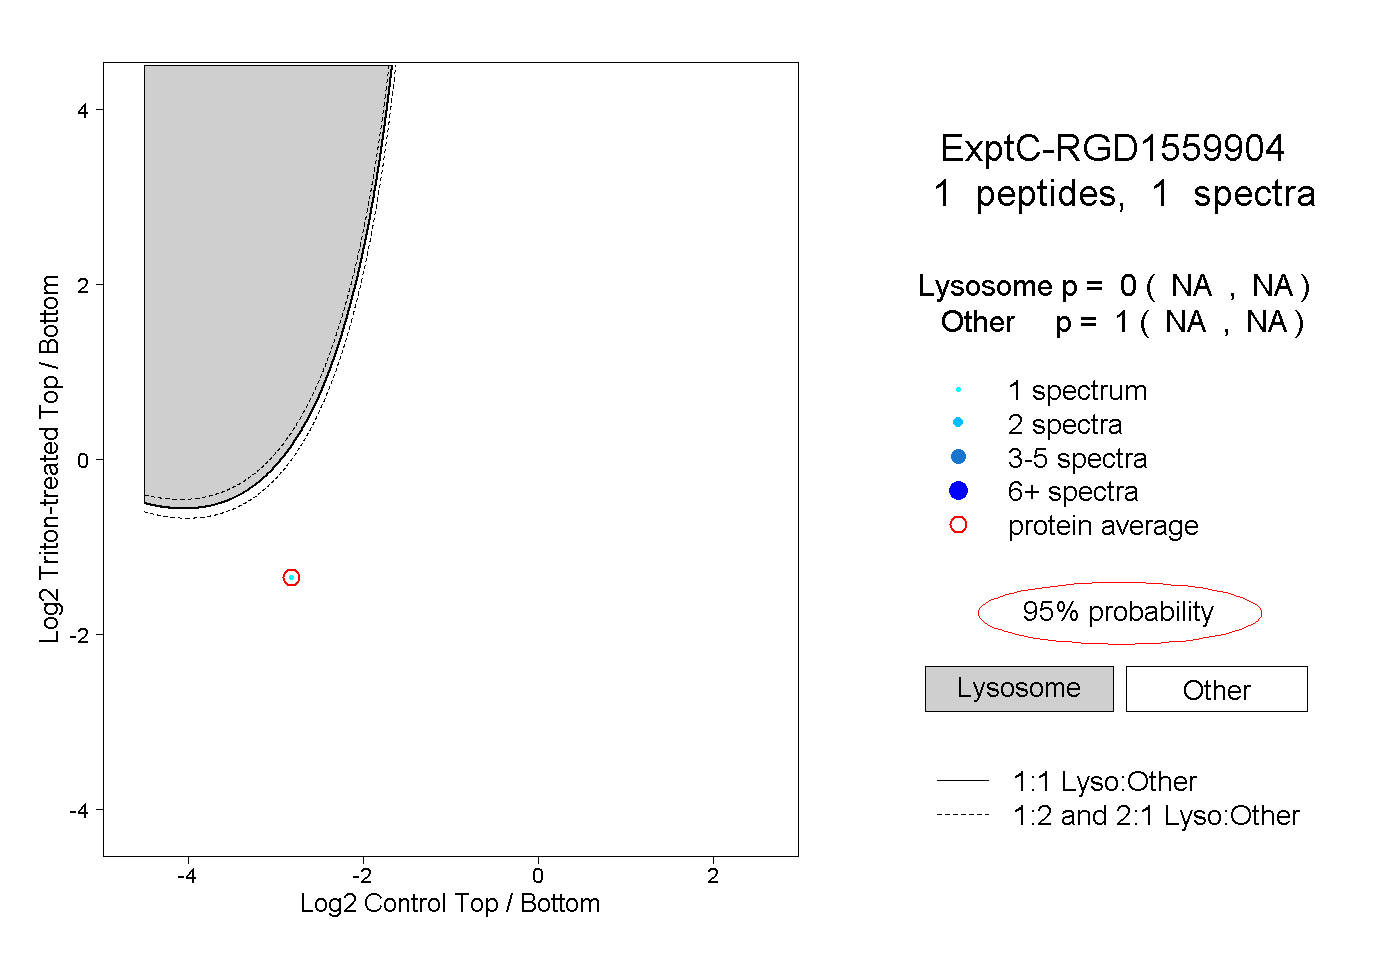
NA | NA
NA | NA