 6
6peptides
spectra
0.000 | 0.000
0.000 | 0.000
0.000 | 0.021
0.000 | 0.000
0.000 | 0.030
0.198 | 0.288
0.439 | 0.523
0.219 | 0.283
| Plot | Mito | Lyso | Perox | ER | Golgi | PM | Cytosol | Nucleus | |||||
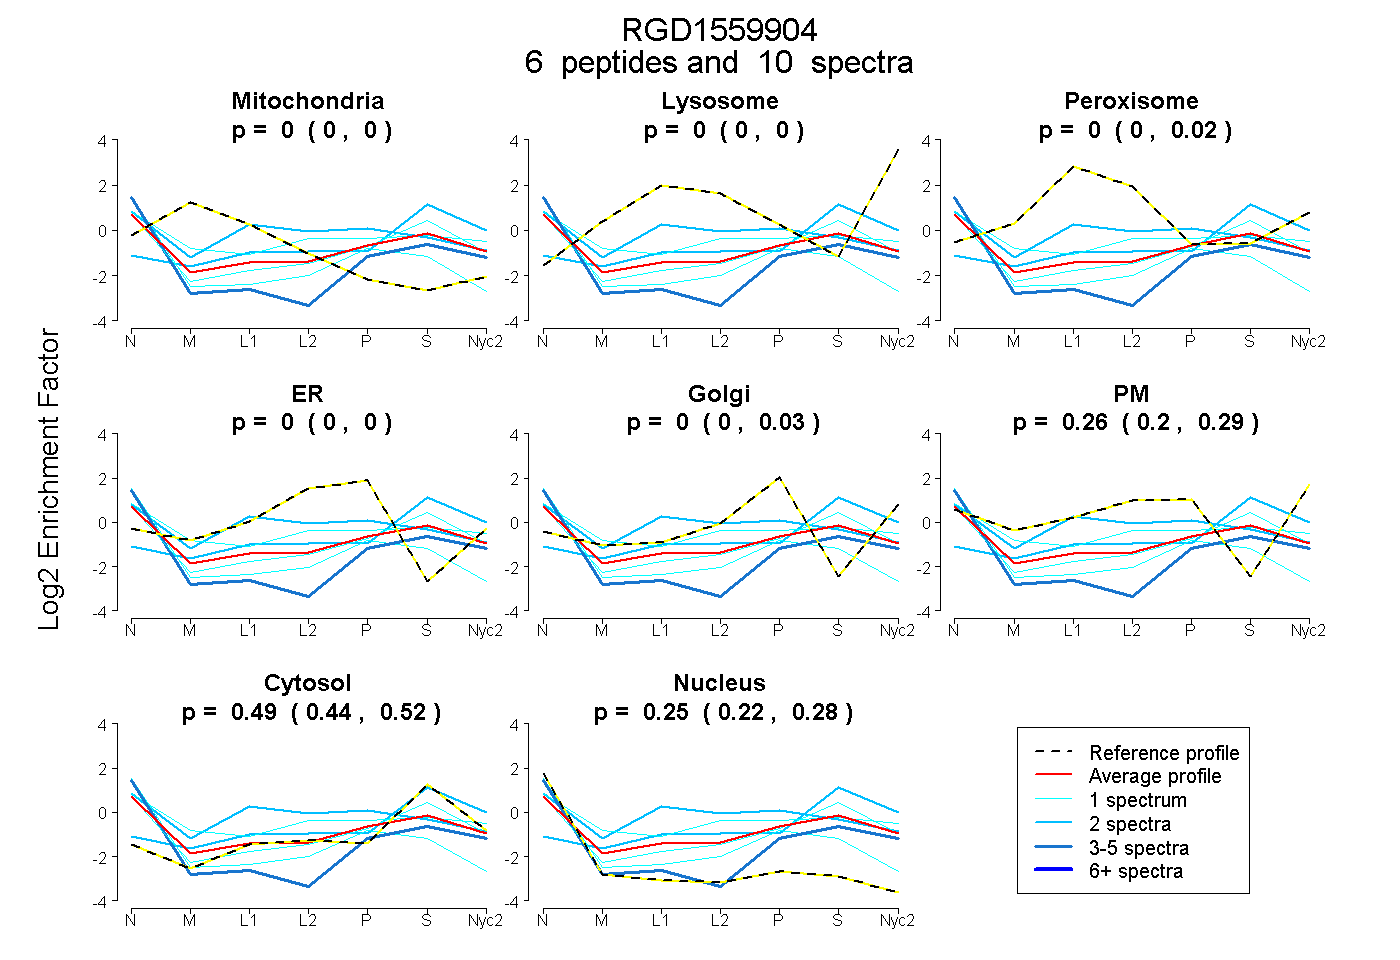
| Expt A |
6 peptides |
10 spectra |
|
0.000 0.000 | 0.000 |
0.000 0.000 | 0.000 |
0.000 0.000 | 0.021 |
0.000 0.000 | 0.000 |
0.000 0.000 | 0.030 |
0.261 0.198 | 0.288 |
0.487 0.439 | 0.523 |
0.252 0.219 | 0.283 |
| 1 spectrum, SPGDSVIR | 0.000 | 0.000 | 0.000 | 0.000 | 0.000 | 0.172 | 0.603 | 0.225 | ||
| 3 spectra, QYTSQTTR | 0.000 | 0.000 | 0.000 | 0.000 | 0.100 | 0.000 | 0.367 | 0.532 | ||
| 1 spectrum, LTELLDLYHEDR | 0.022 | 0.000 | 0.073 | 0.000 | 0.000 | 0.379 | 0.363 | 0.164 | ||
| 1 spectrum, LLELILLDQTVR | 0.000 | 0.000 | 0.000 | 0.121 | 0.052 | 0.000 | 0.229 | 0.599 | ||
| 2 spectra, LLEELVR | 0.001 | 0.147 | 0.000 | 0.000 | 0.000 | 0.037 | 0.816 | 0.000 | ||
| 2 spectra, CCSDFDLHSELER | 0.000 | 0.000 | 0.322 | 0.203 | 0.000 | 0.058 | 0.233 | 0.185 |
| Plot | Mito | Lyso or Perox | ER | Golgi | PM | Cytosol | Nucleus | ||||||
| Expt B |
2 peptides |
3 spectra |
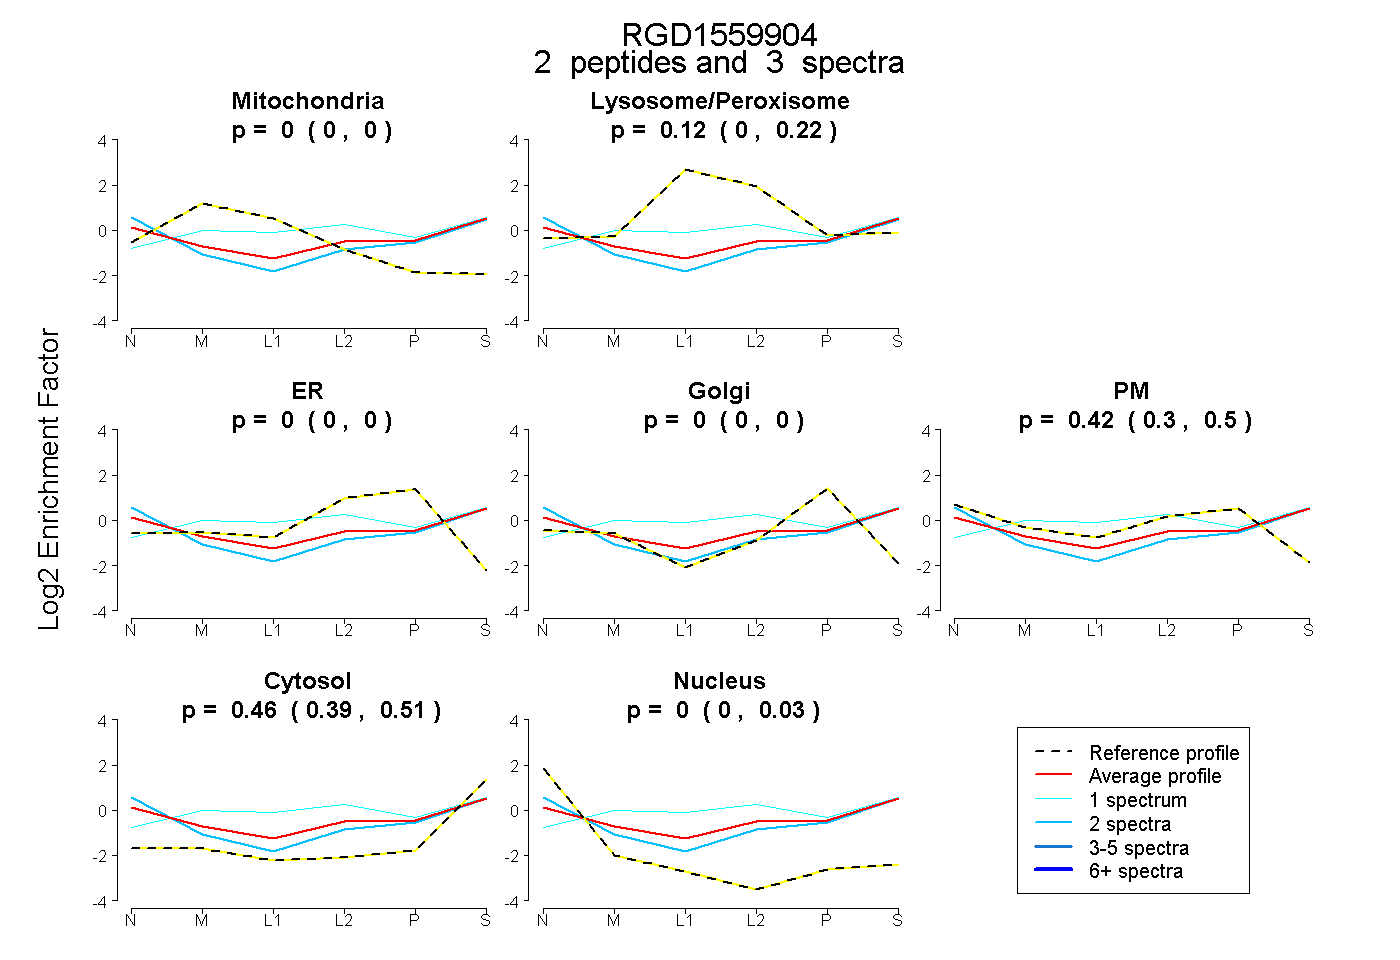 |
0.000 0.000 | 0.000 |
0.118 0.000 | 0.224 |
0.000 0.000 | 0.000 |
0.000 0.000 | 0.000 |
0.422 0.301 | 0.503 |
0.459 0.388 | 0.513 |
0.000 0.000 | 0.030 |
|||
| Plot | Lyso | Other | |||||||||||
| Expt C |
1 peptide |
1 spectrum |
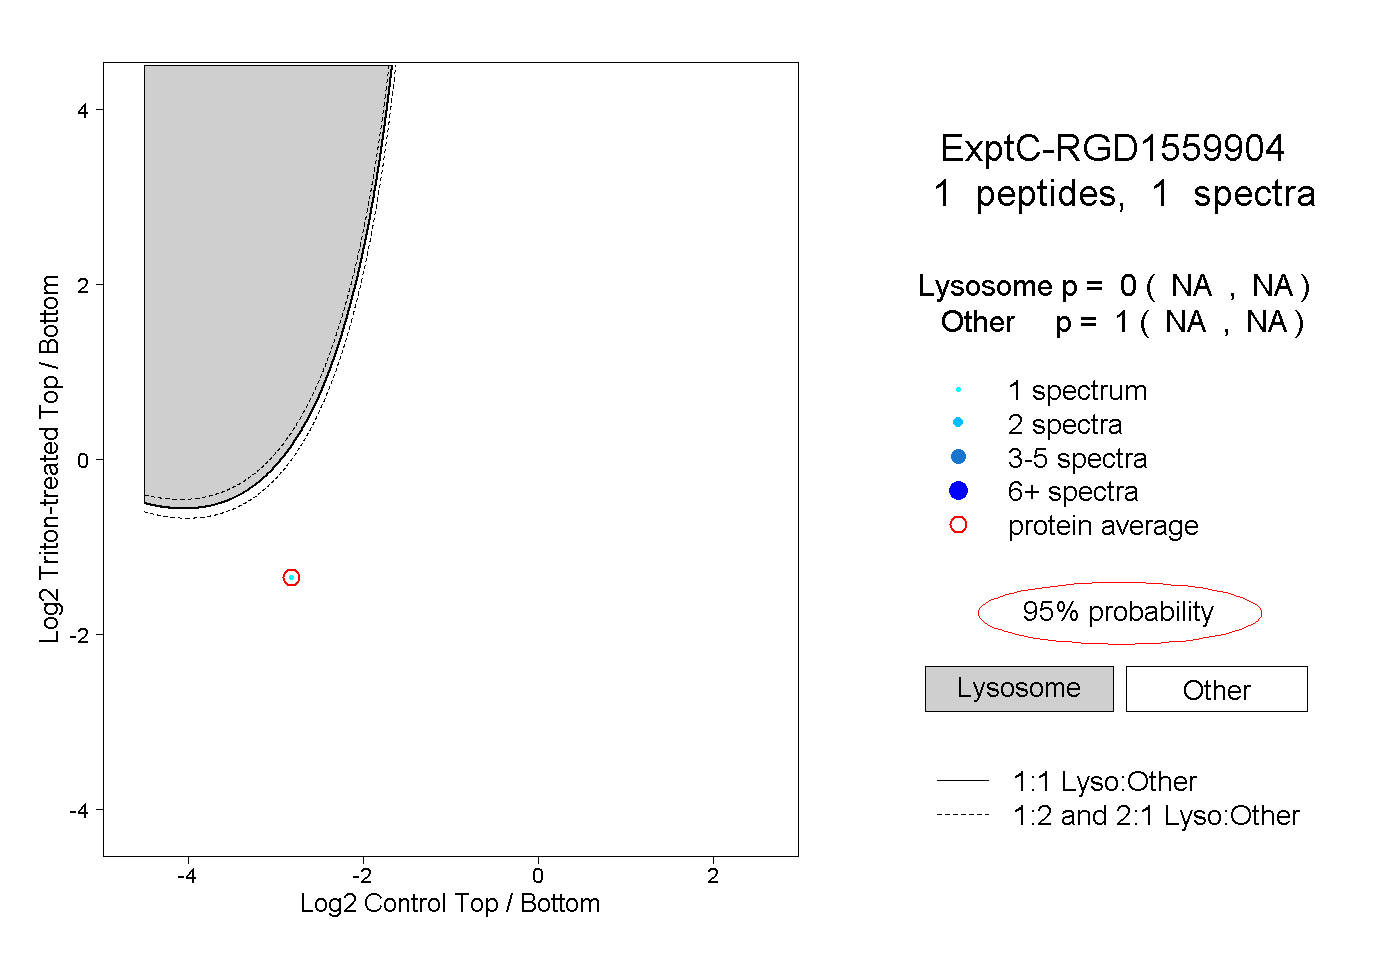 |
0.000 NA | NA |
1.000 NA | NA |