 10
10peptides
spectra
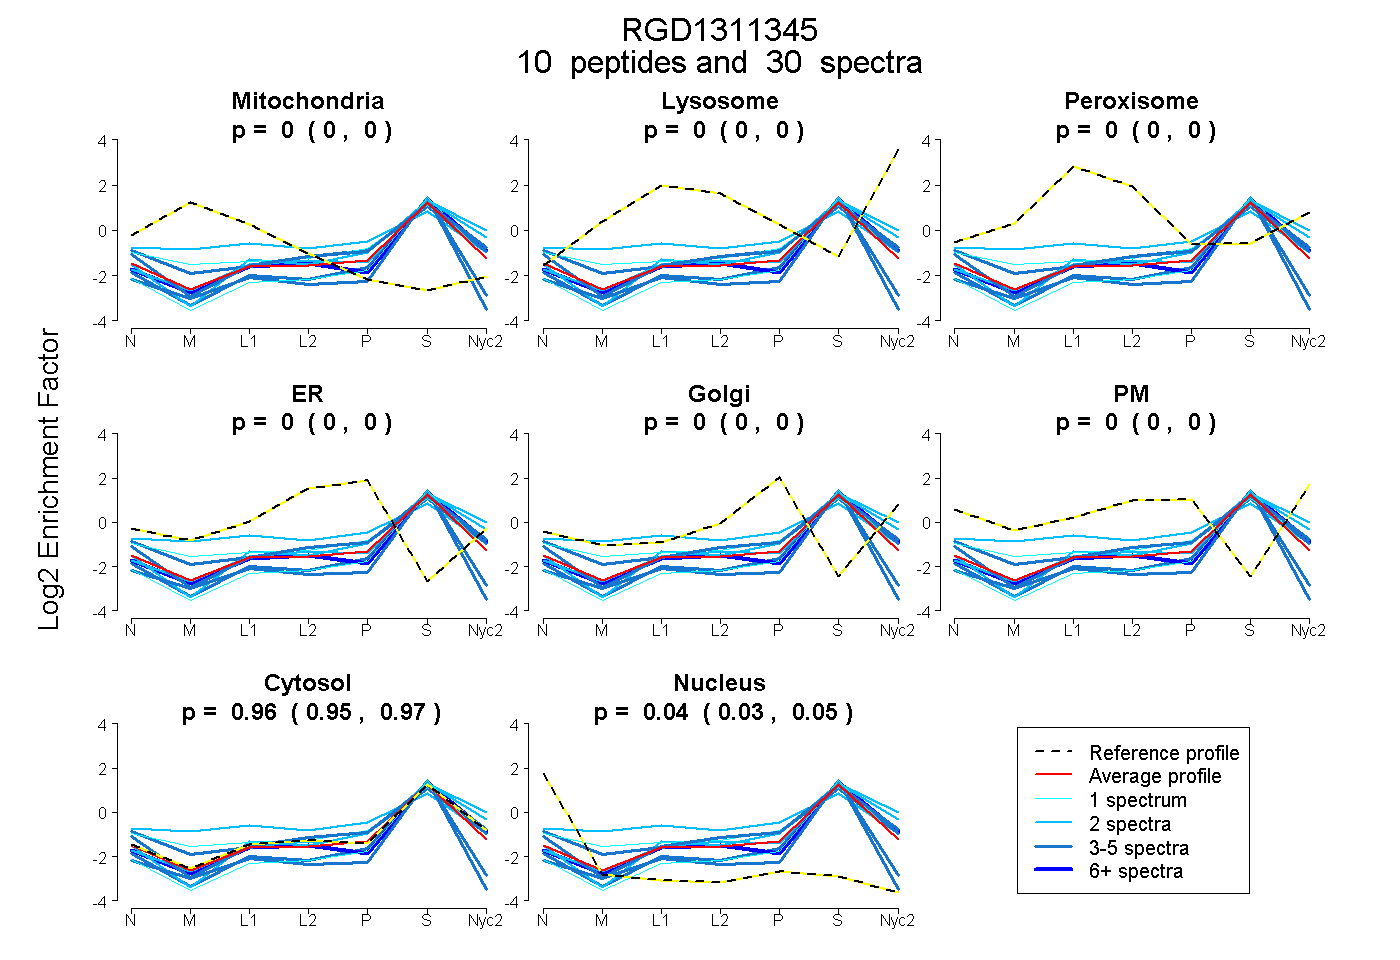
0.000 | 0.000
0.000 | 0.000
0.000 | 0.000
0.000 | 0.000
0.000 | 0.000
0.000 | 0.000
0.950 | 0.969
0.029 | 0.048
3peptides
spectra
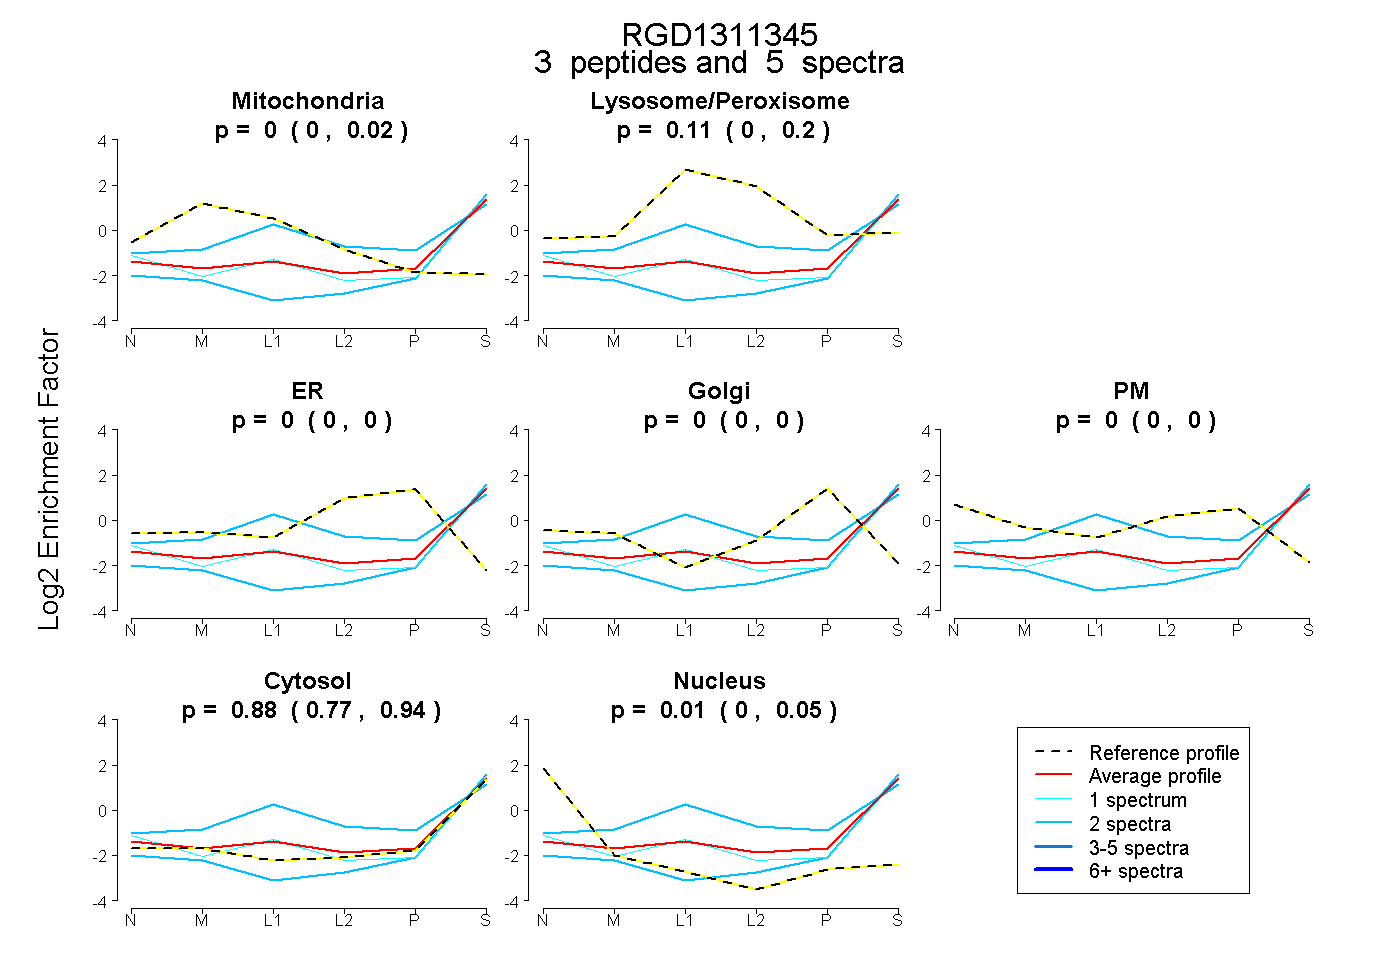
0.000 | 0.022
0.000 | 0.199
0.000 | 0.000
0.000 | 0.000
0.000 | 0.000
0.775 | 0.940
0.000 | 0.049
8peptides
spectra
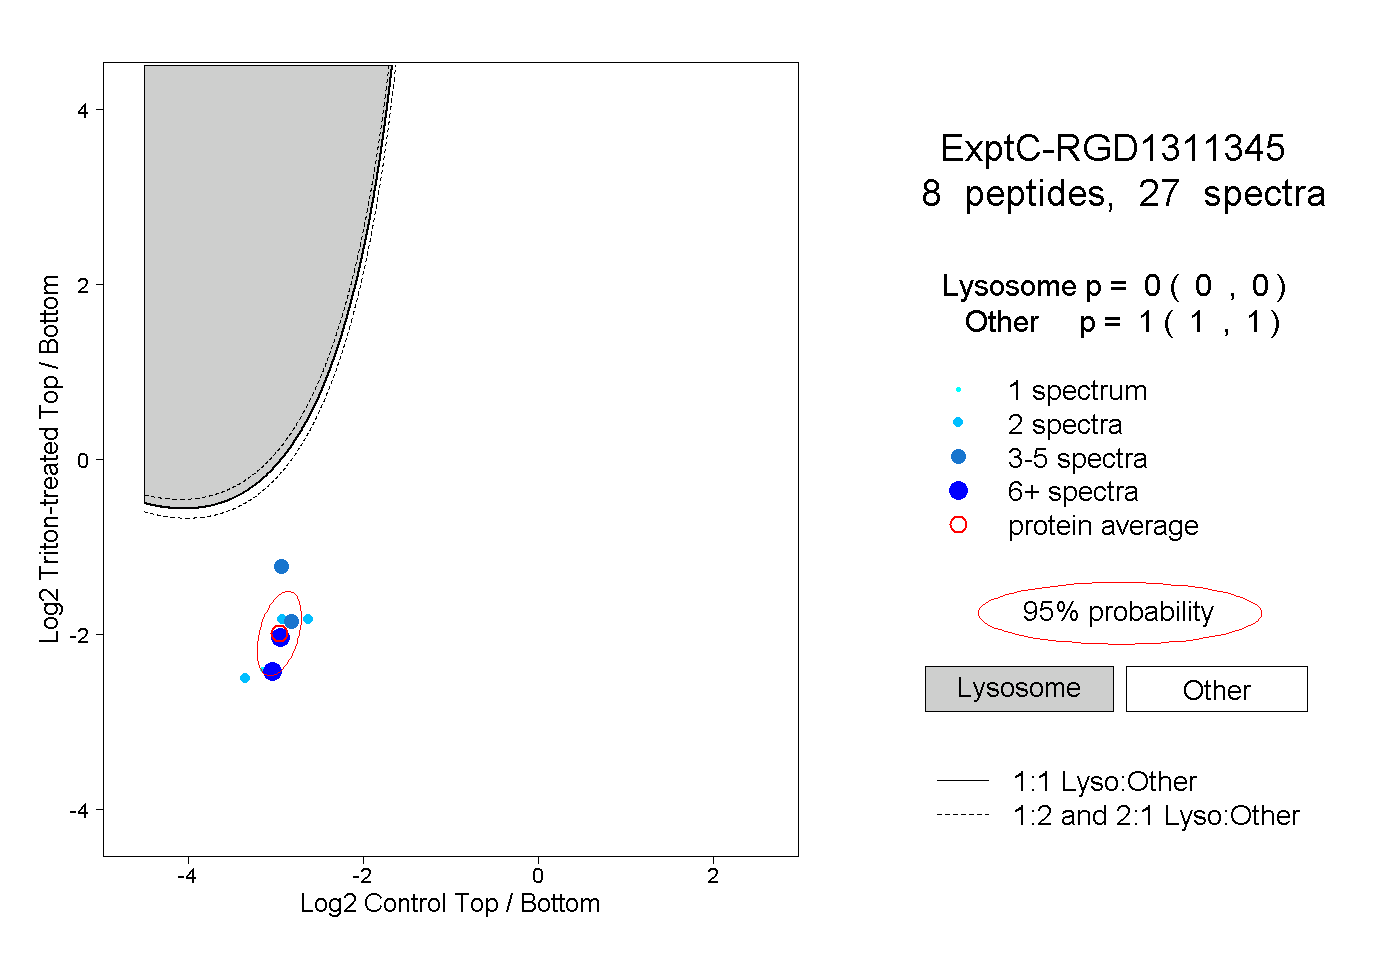
0.000 | 0.000
1.000 | 1.000
3peptides
spectra
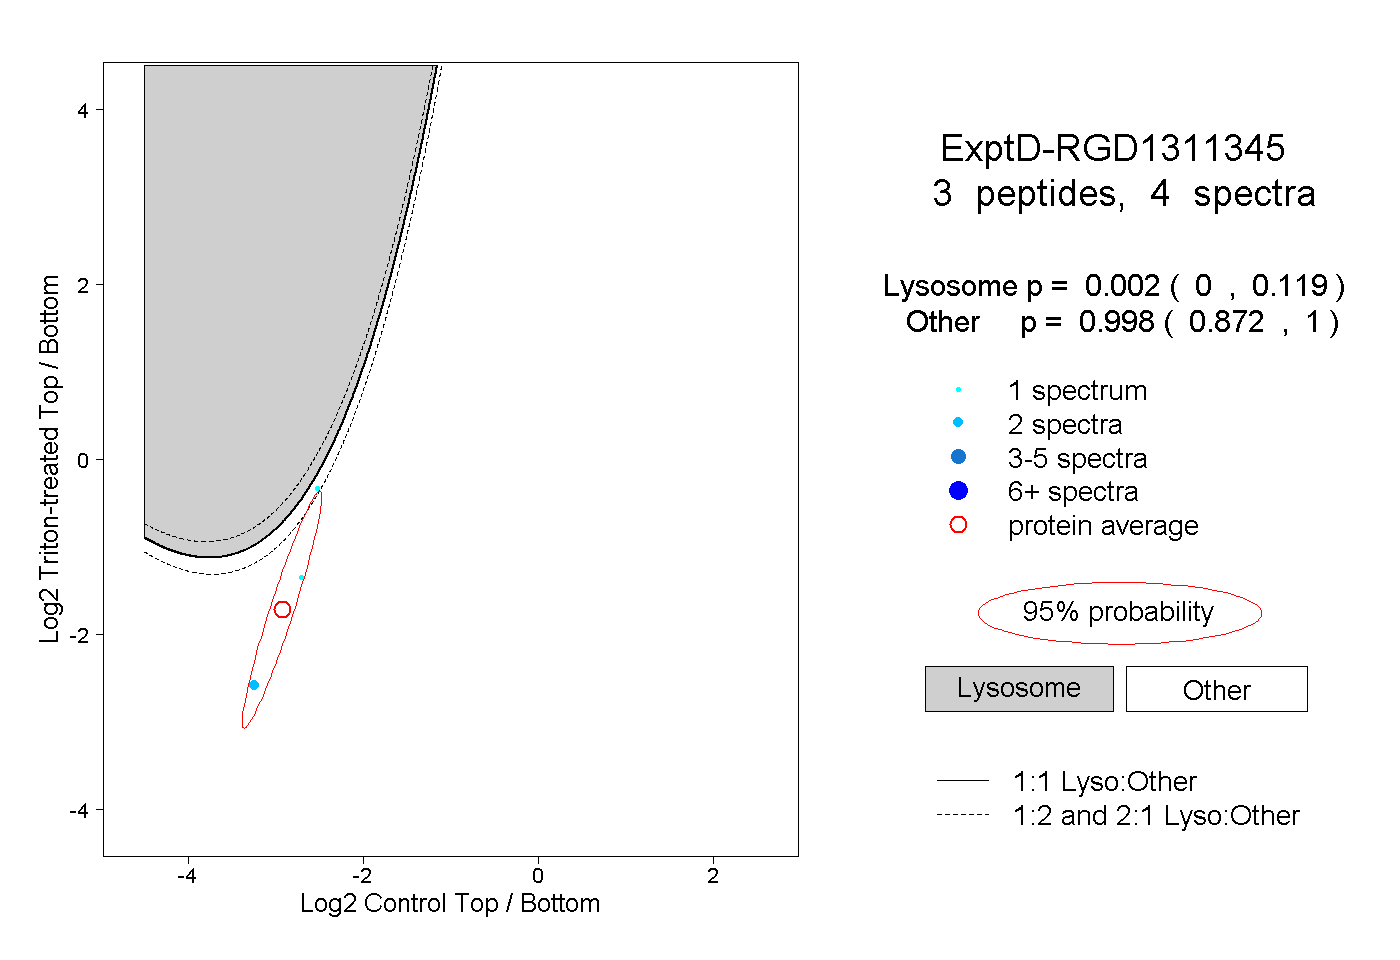
0.000 | 0.119
0.872 | 1.000