 10
10peptides
spectra
0.000 | 0.000
0.000 | 0.000
0.000 | 0.000
0.000 | 0.000
0.000 | 0.000
0.000 | 0.000
0.950 | 0.969
0.029 | 0.048
| Plot | Mito | Lyso | Perox | ER | Golgi | PM | Cytosol | Nucleus | |||||
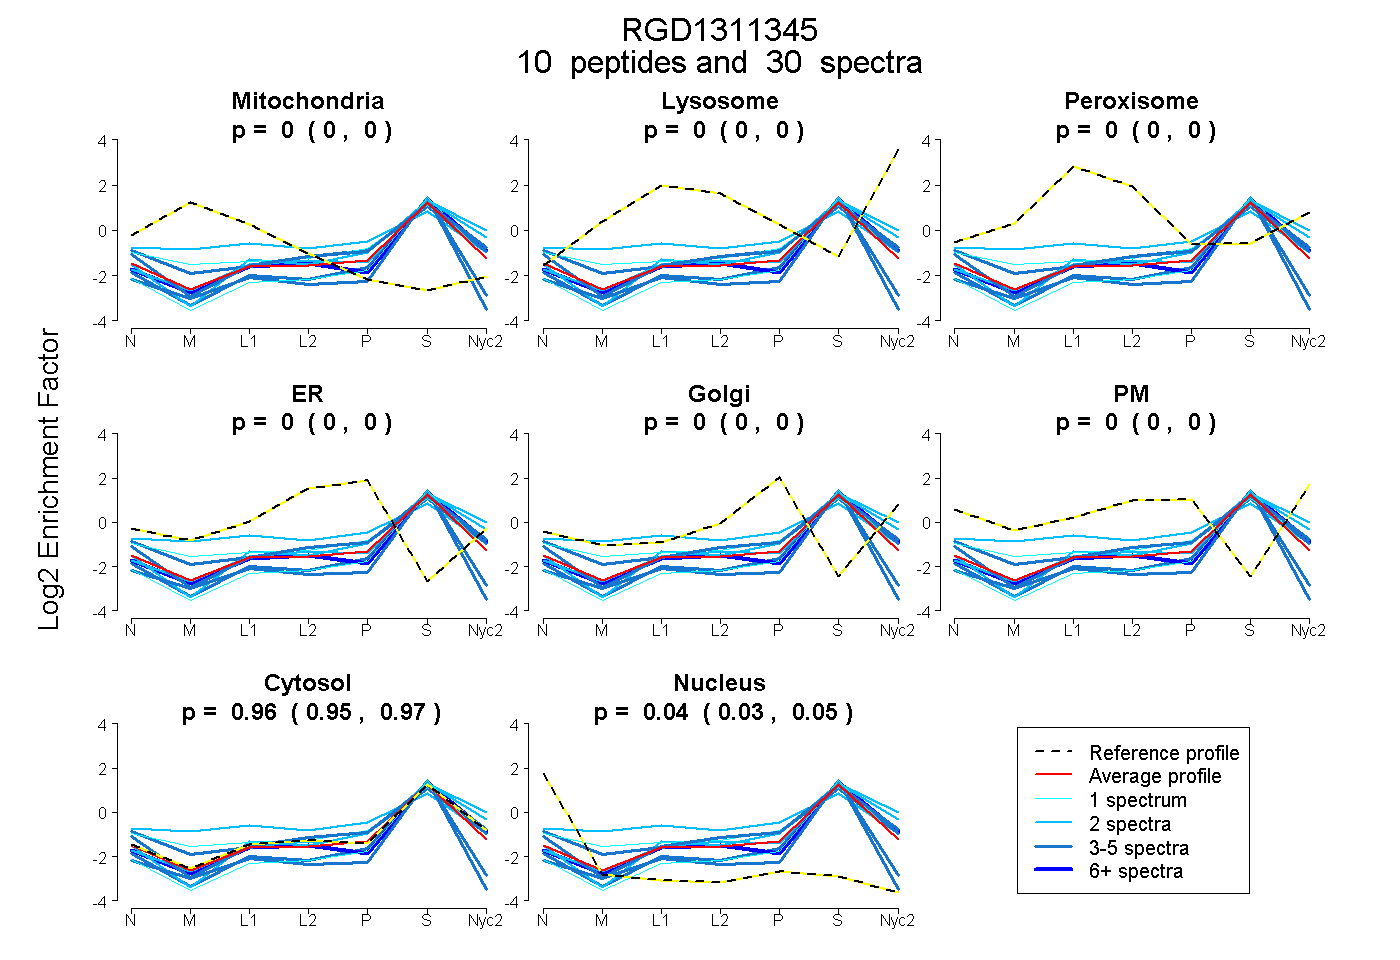
| Expt A |
10 peptides |
30 spectra |
|
0.000 0.000 | 0.000 |
0.000 0.000 | 0.000 |
0.000 0.000 | 0.000 |
0.000 0.000 | 0.000 |
0.000 0.000 | 0.000 |
0.000 0.000 | 0.000 |
0.961 0.950 | 0.969 |
0.039 0.029 | 0.048 |
| 3 spectra, GCSIWCVELIR | 0.000 | 0.000 | 0.000 | 0.000 | 0.000 | 0.000 | 0.798 | 0.202 | ||
| 6 spectra, DEAWFEGK | 0.000 | 0.000 | 0.000 | 0.000 | 0.000 | 0.000 | 1.000 | 0.000 | ||
| 2 spectra, DVGVDR | 0.000 | 0.000 | 0.000 | 0.000 | 0.016 | 0.000 | 0.984 | 0.000 | ||
| 4 spectra, DCLVELLEK | 0.000 | 0.000 | 0.000 | 0.000 | 0.000 | 0.000 | 0.842 | 0.158 | ||
| 2 spectra, ALHELNPR | 0.125 | 0.000 | 0.146 | 0.021 | 0.068 | 0.000 | 0.640 | 0.000 | ||
| 5 spectra, YSDELLK | 0.000 | 0.000 | 0.000 | 0.000 | 0.050 | 0.000 | 0.943 | 0.007 | ||
| 1 spectrum, ILNETGK | 0.073 | 0.000 | 0.013 | 0.000 | 0.093 | 0.000 | 0.822 | 0.000 | ||
| 1 spectrum, VAELLLPAAVAWR | 0.000 | 0.000 | 0.000 | 0.000 | 0.000 | 0.000 | 0.954 | 0.046 | ||
| 4 spectra, GVPFHR | 0.035 | 0.000 | 0.000 | 0.015 | 0.076 | 0.000 | 0.855 | 0.020 | ||
| 2 spectra, SDTAVPMPLLEER | 0.000 | 0.046 | 0.000 | 0.000 | 0.000 | 0.000 | 0.954 | 0.000 |
| Plot | Mito | Lyso or Perox | ER | Golgi | PM | Cytosol | Nucleus | ||||||
| Expt B |
3 peptides |
5 spectra |
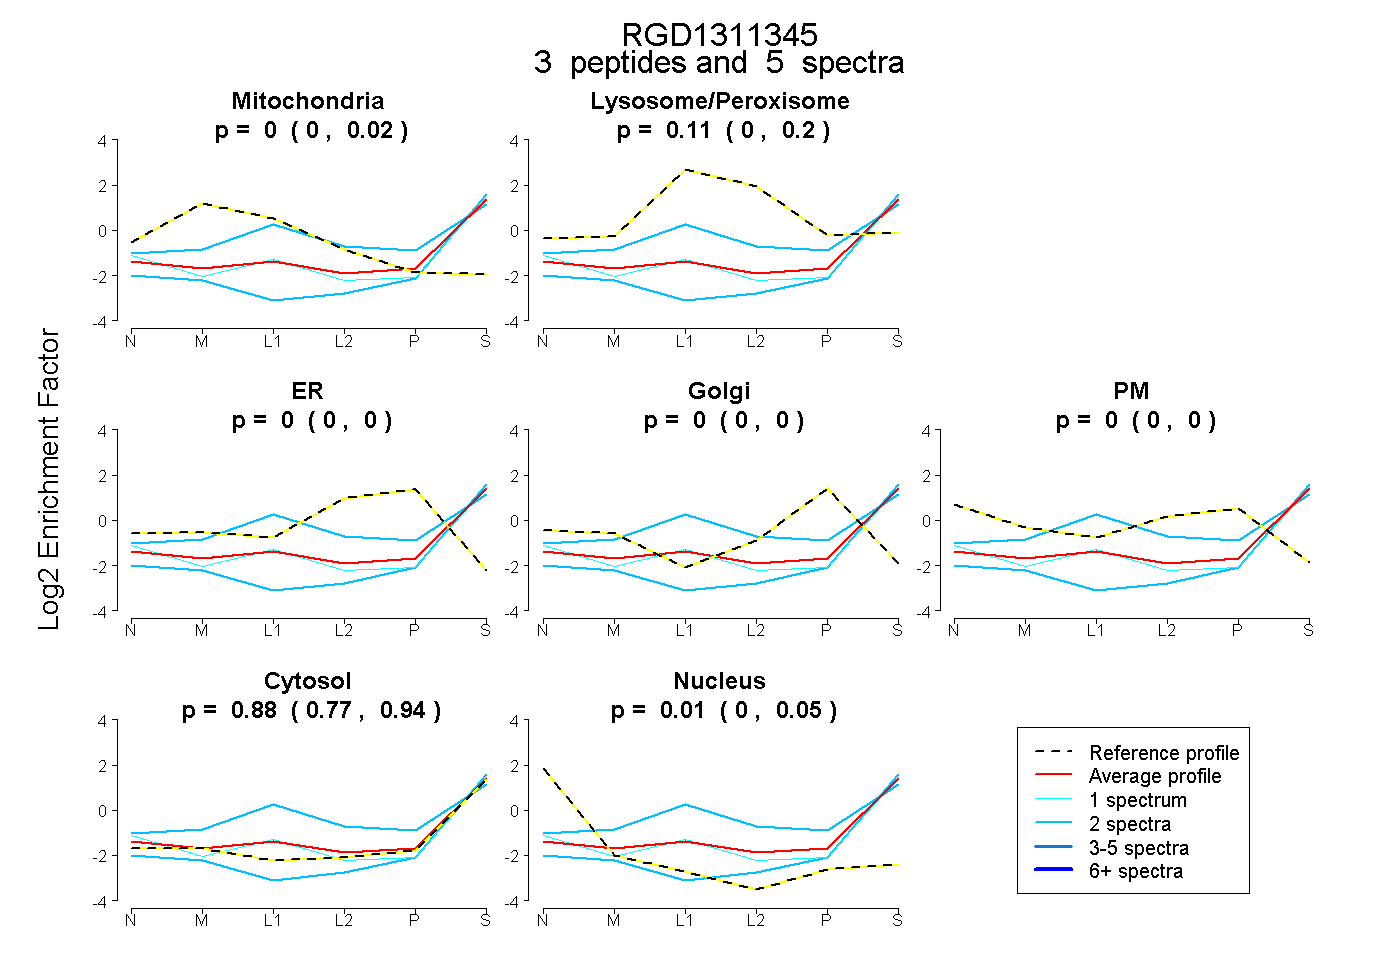 |
0.000 0.000 | 0.022 |
0.112 0.000 | 0.199 |
0.000 0.000 | 0.000 |
0.000 0.000 | 0.000 |
0.000 0.000 | 0.000 |
0.878 0.775 | 0.940 |
0.010 0.000 | 0.049 |
|||
| Plot | Lyso | Other | |||||||||||
| Expt C |
8 peptides |
27 spectra |
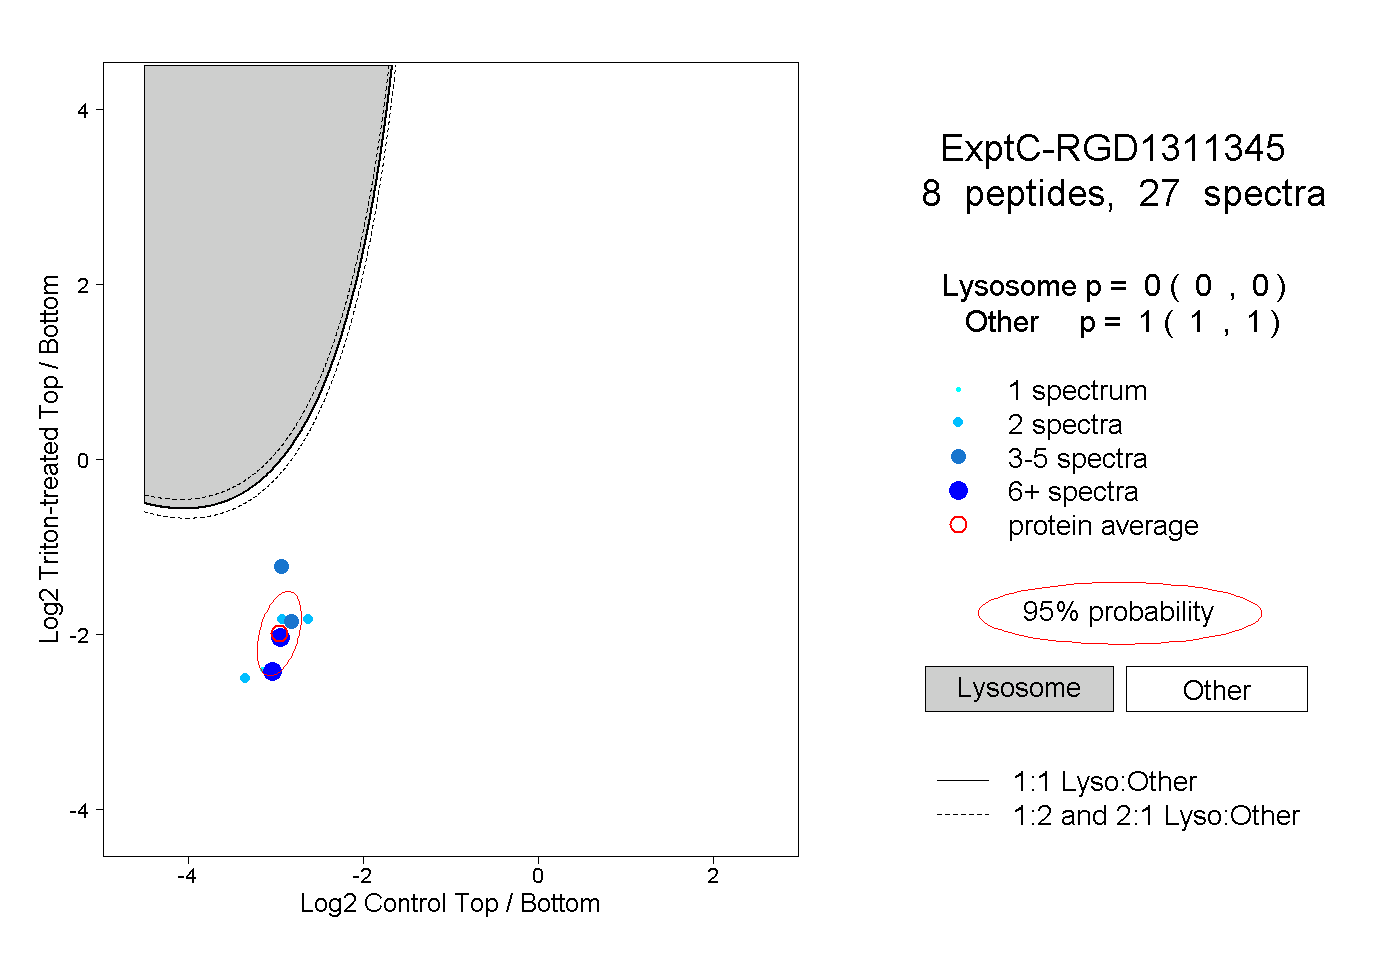 |
0.000 0.000 | 0.000 |
1.000 1.000 | 1.000 |
||||||||
| Plot | Lyso | Other | |||||||||||
| Expt D |
3 peptides |
4 spectra |
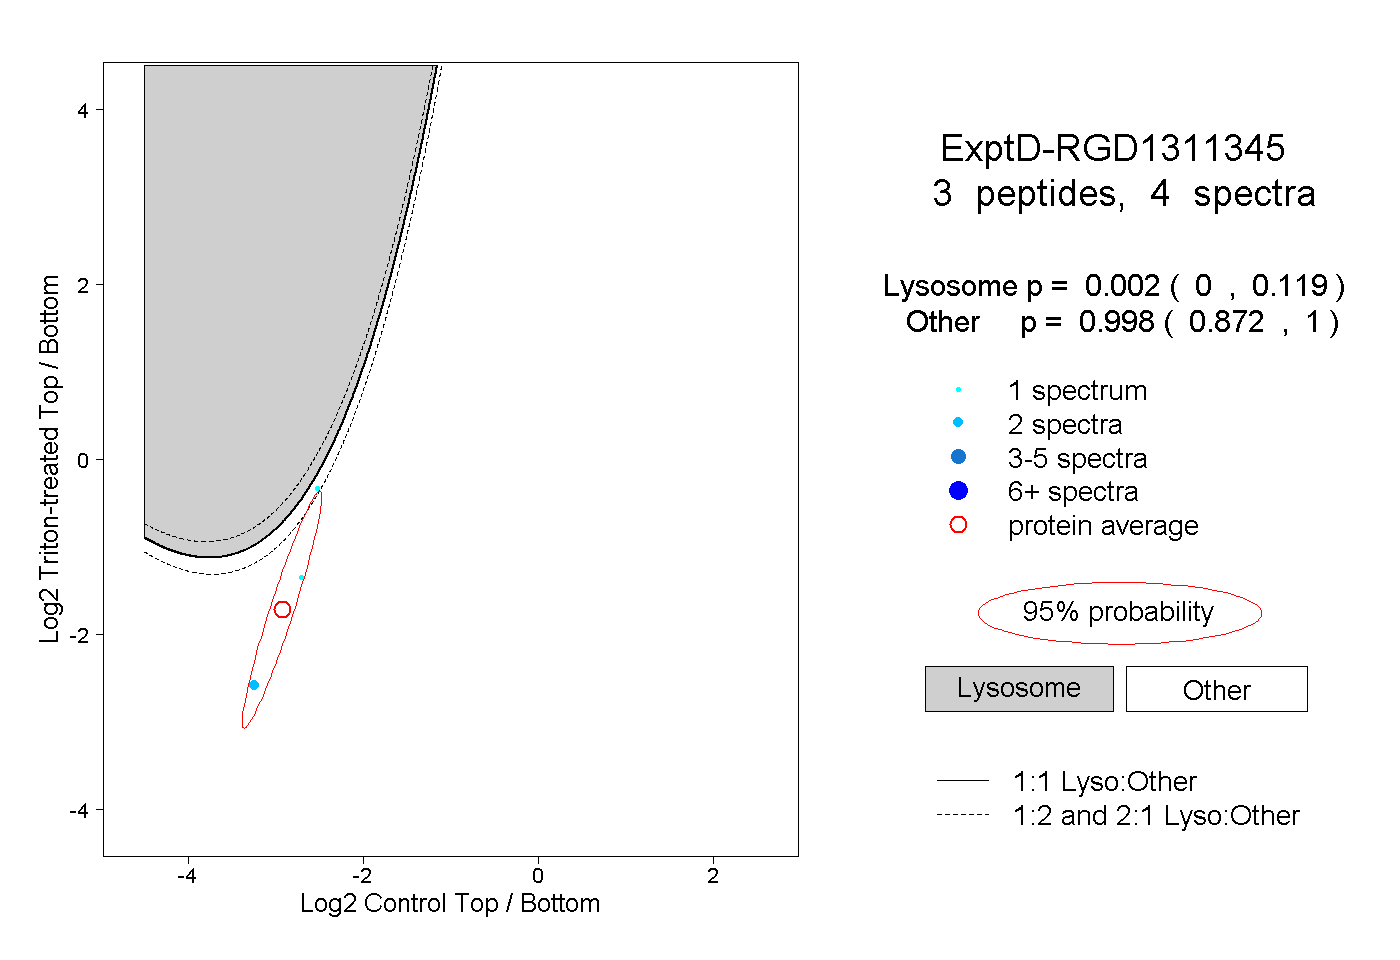 |
0.002 0.000 | 0.119 |
0.998 0.872 | 1.000 |