 7
7peptides
spectra
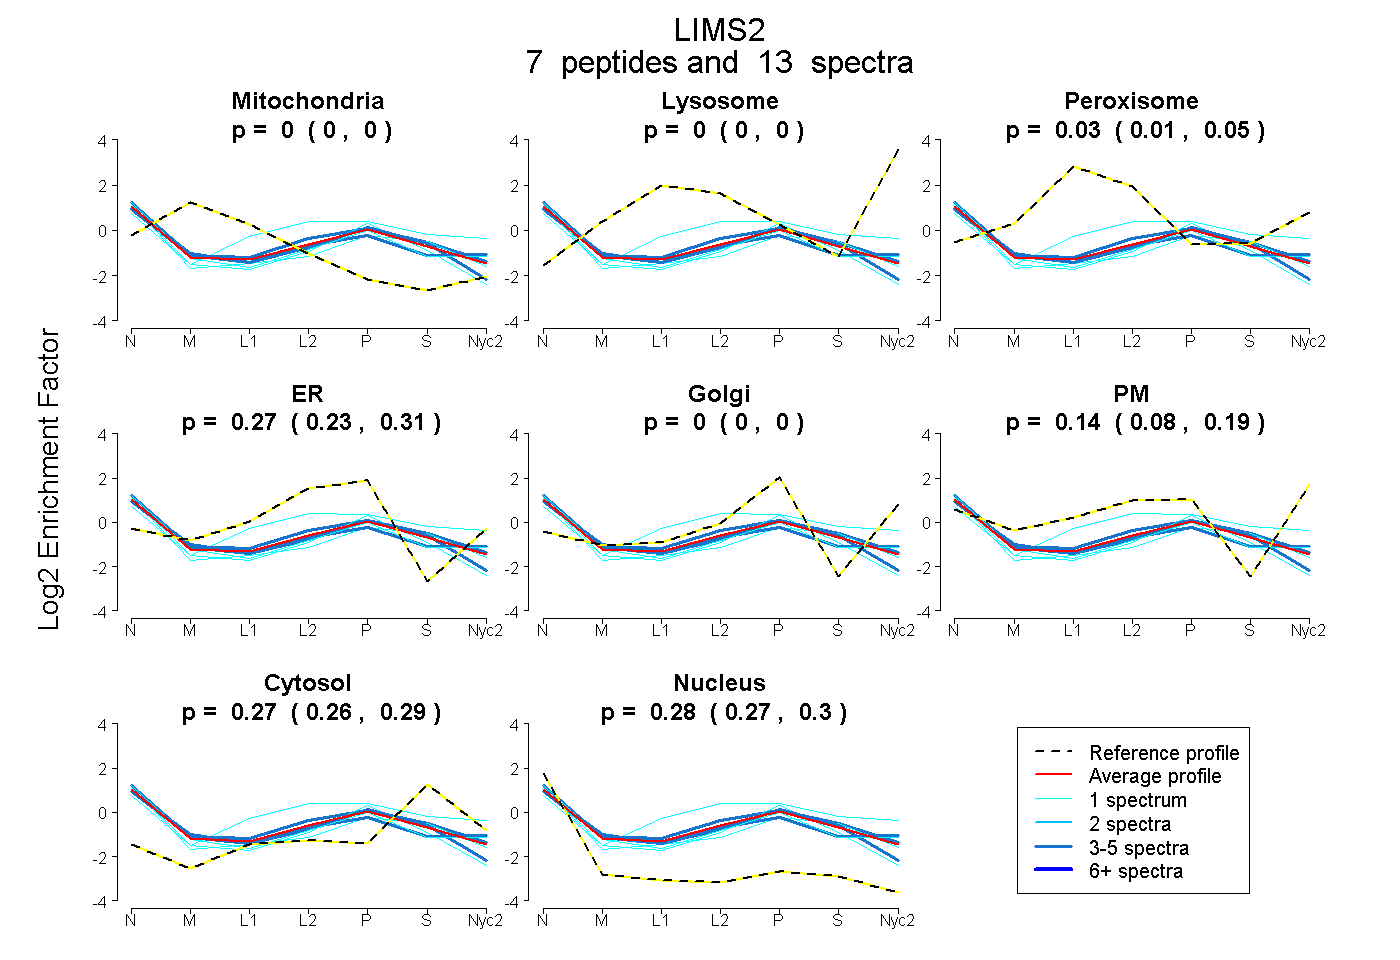
0.000 | 0.000
0.000 | 0.000
0.007 | 0.051
0.229 | 0.307
0.000 | 0.000
0.085 | 0.188
0.255 | 0.290
0.270 | 0.295
2peptides
spectra
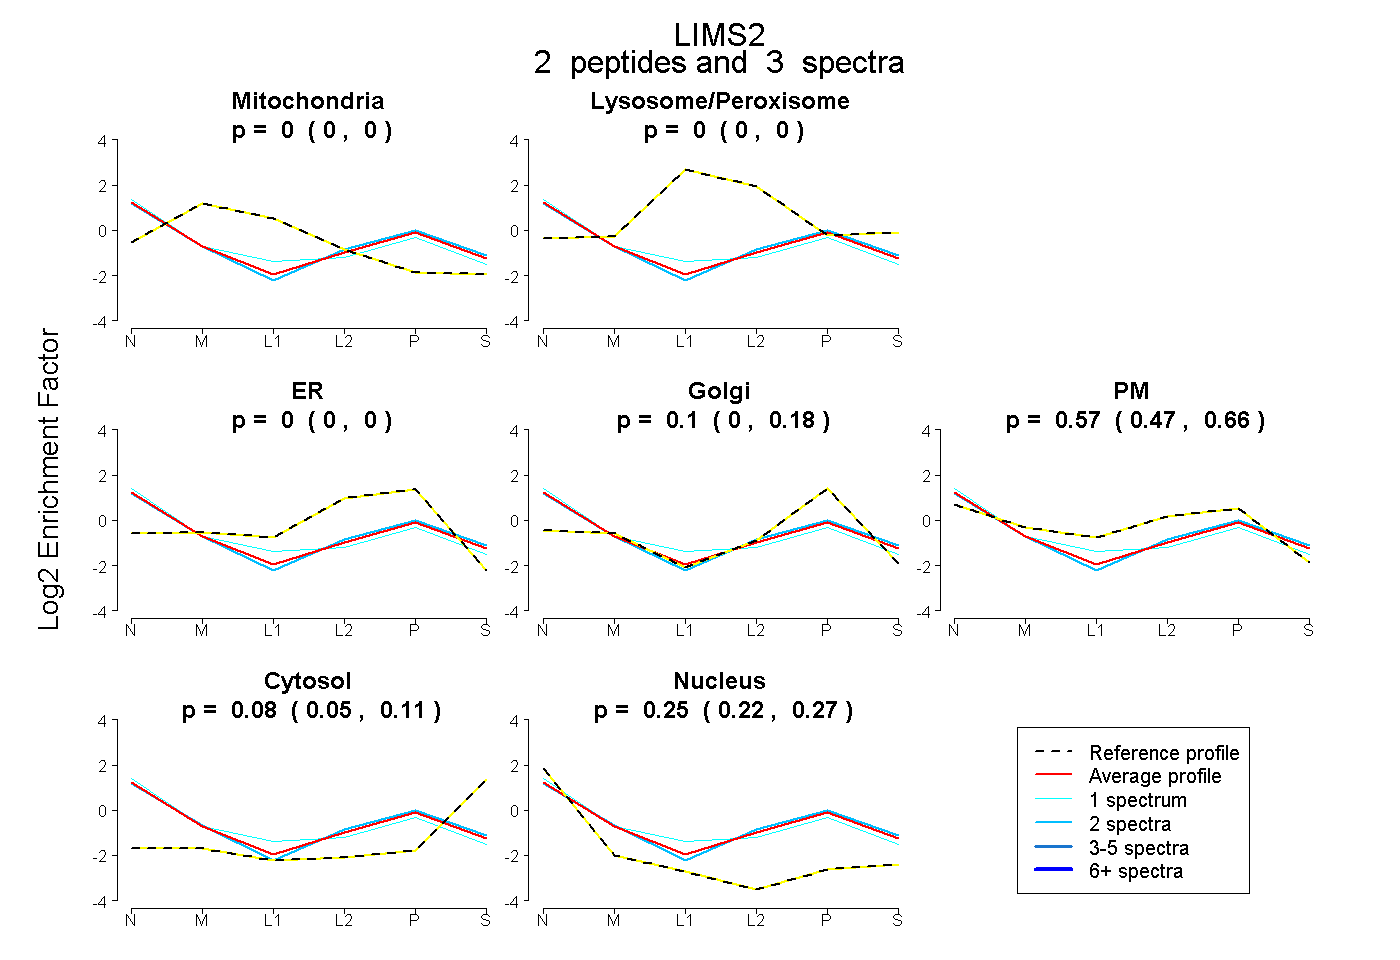
0.000 | 0.000
0.000 | 0.000
0.000 | 0.000
0.000 | 0.183
0.465 | 0.661
0.048 | 0.107
0.217 | 0.273
3peptides
spectra
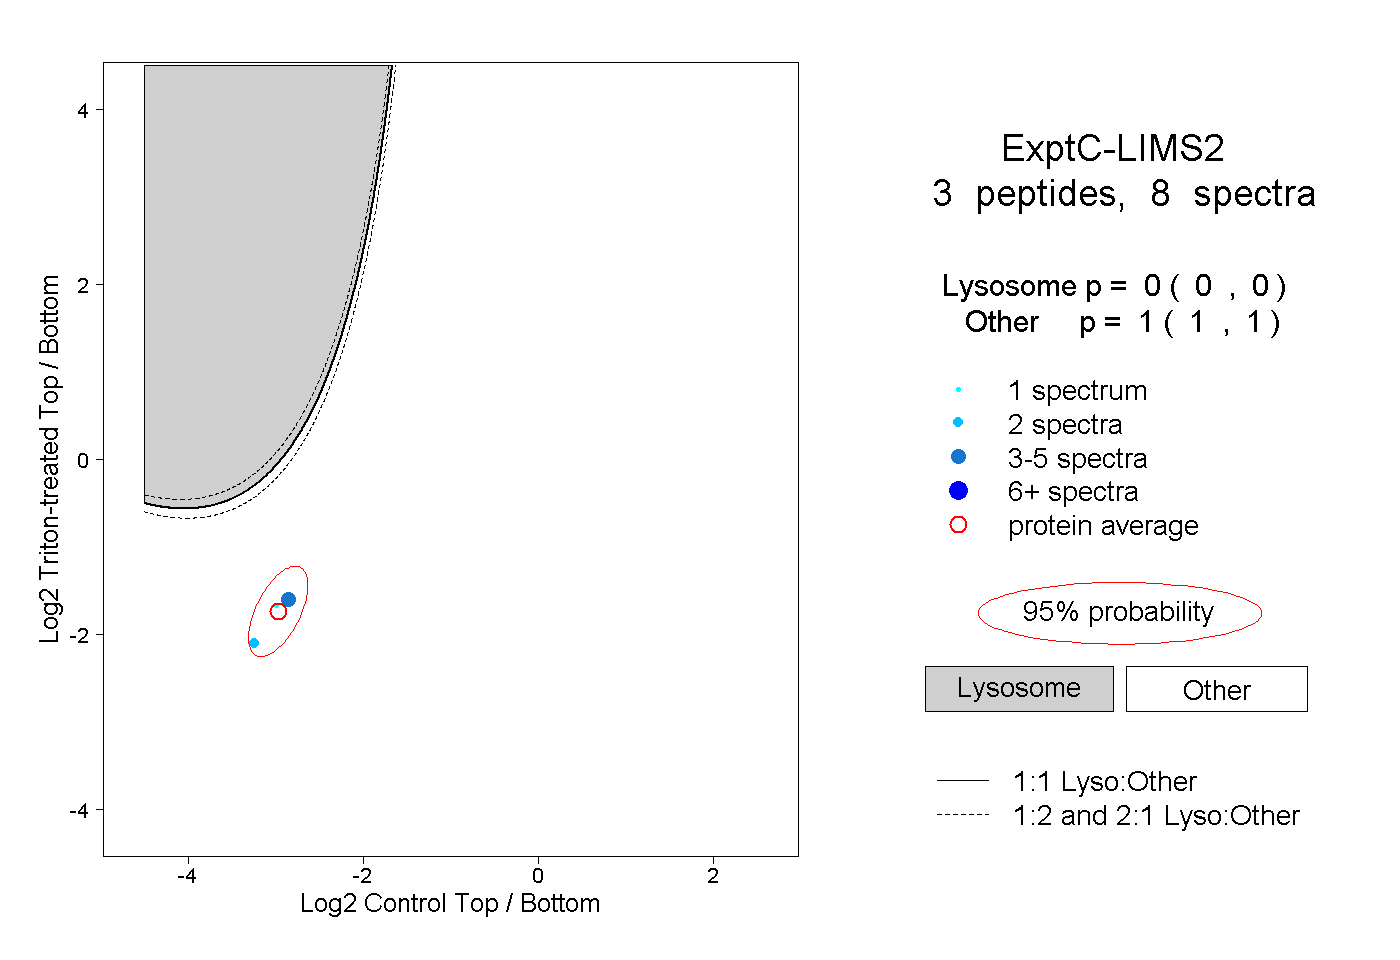
0.000 | 0.000
1.000 | 1.000