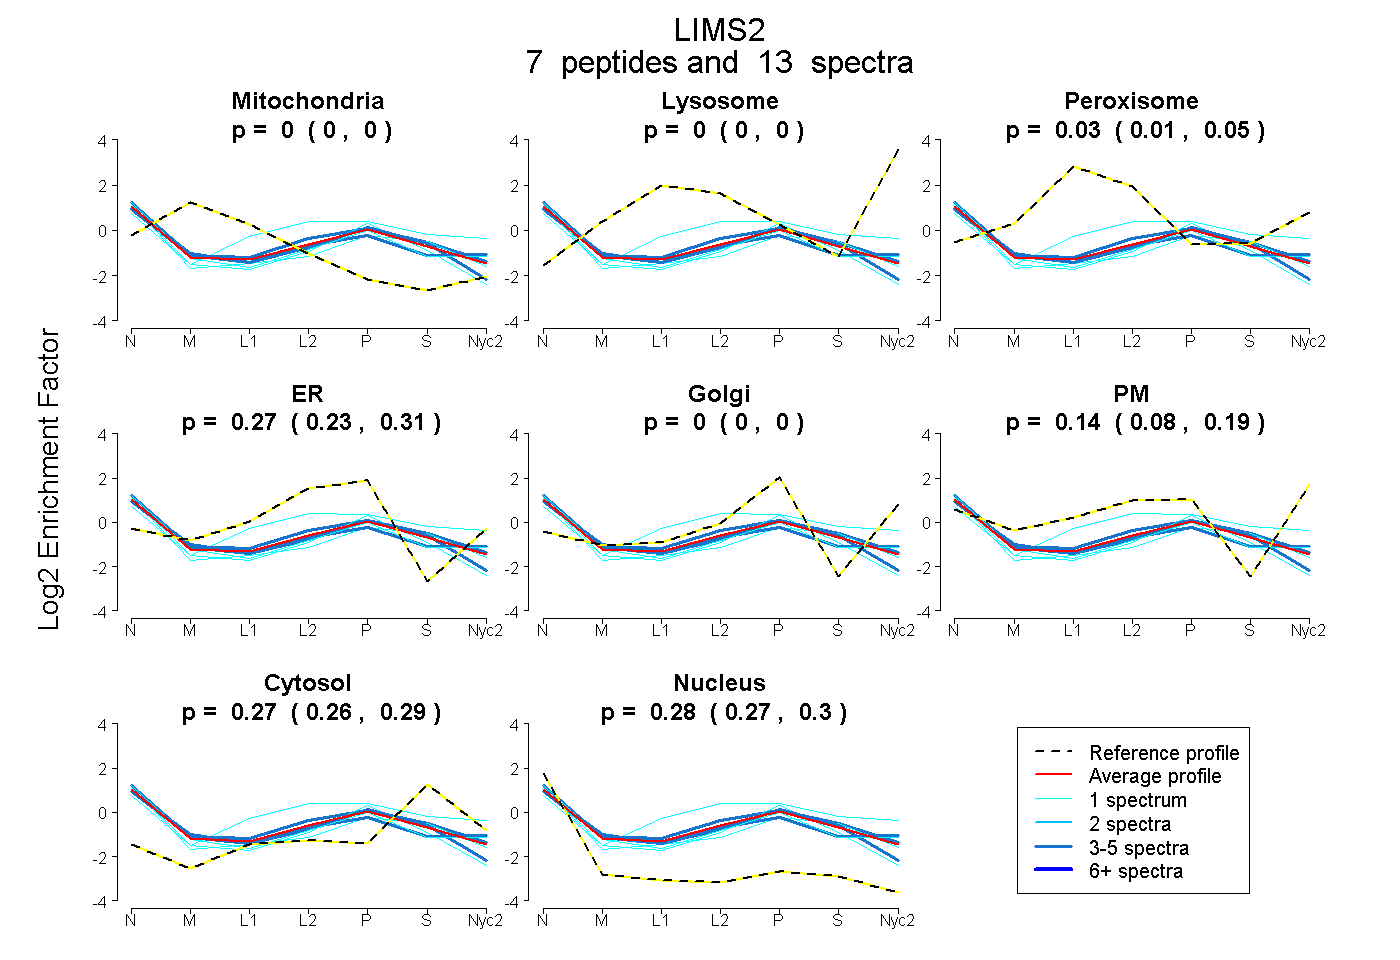
 7
7peptides
spectra
0.000 | 0.000
0.000 | 0.000
0.007 | 0.051
0.229 | 0.307
0.000 | 0.000
0.085 | 0.188
0.255 | 0.290
0.270 | 0.295
| Plot | Mito | Lyso | Perox | ER | Golgi | PM | Cytosol | Nucleus | |||||
| Expt A |
7 peptides |
13 spectra |
|
0.000 0.000 | 0.000 |
0.000 0.000 | 0.000 |
0.029 0.007 | 0.051 |
0.272 0.229 | 0.307 |
0.000 0.000 | 0.000 |
0.141 0.085 | 0.188 |
0.274 0.255 | 0.290 |
0.283 0.270 | 0.295 |
| 3 spectra, MGIPICGACR | 0.056 | 0.000 | 0.000 | 0.373 | 0.000 | 0.000 | 0.285 | 0.286 | ||
| 3 spectra, FAPTER | 0.000 | 0.000 | 0.009 | 0.093 | 0.000 | 0.365 | 0.211 | 0.321 | ||
| 3 spectra, AMNANWHPGCFR | 0.000 | 0.000 | 0.059 | 0.295 | 0.000 | 0.108 | 0.297 | 0.241 | ||
| 1 spectrum, VVNALGK | 0.000 | 0.000 | 0.000 | 0.110 | 0.050 | 0.301 | 0.202 | 0.337 | ||
| 1 spectrum, CHLAIDEQPLMFK | 0.000 | 0.000 | 0.118 | 0.218 | 0.000 | 0.242 | 0.360 | 0.062 | ||
| 1 spectrum, ELTSDAR | 0.000 | 0.000 | 0.000 | 0.156 | 0.000 | 0.169 | 0.350 | 0.325 | ||
| 1 spectrum, CELCDVELADLGFVK | 0.000 | 0.000 | 0.000 | 0.394 | 0.000 | 0.000 | 0.223 | 0.383 |
| Plot | Mito | Lyso or Perox | ER | Golgi | PM | Cytosol | Nucleus | ||||||
| Expt B |
2 peptides |
3 spectra |
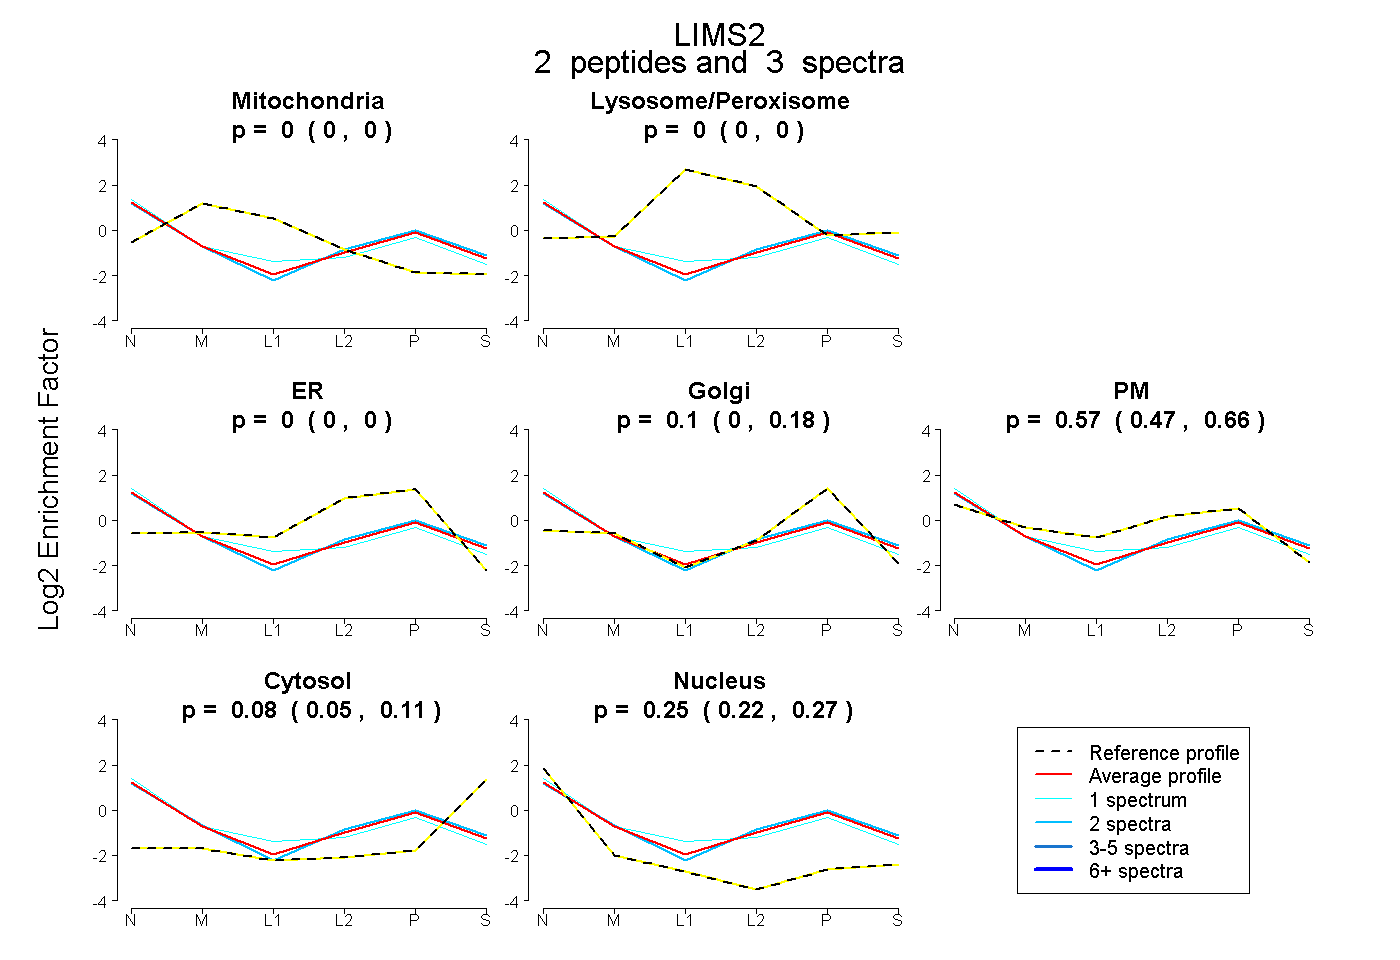 |
0.000 0.000 | 0.000 |
0.000 0.000 | 0.000 |
0.000 0.000 | 0.000 |
0.100 0.000 | 0.183 |
0.572 0.465 | 0.661 |
0.081 0.048 | 0.107 |
0.248 0.217 | 0.273 |
|||
| Plot | Lyso | Other | |||||||||||
| Expt C |
3 peptides |
8 spectra |
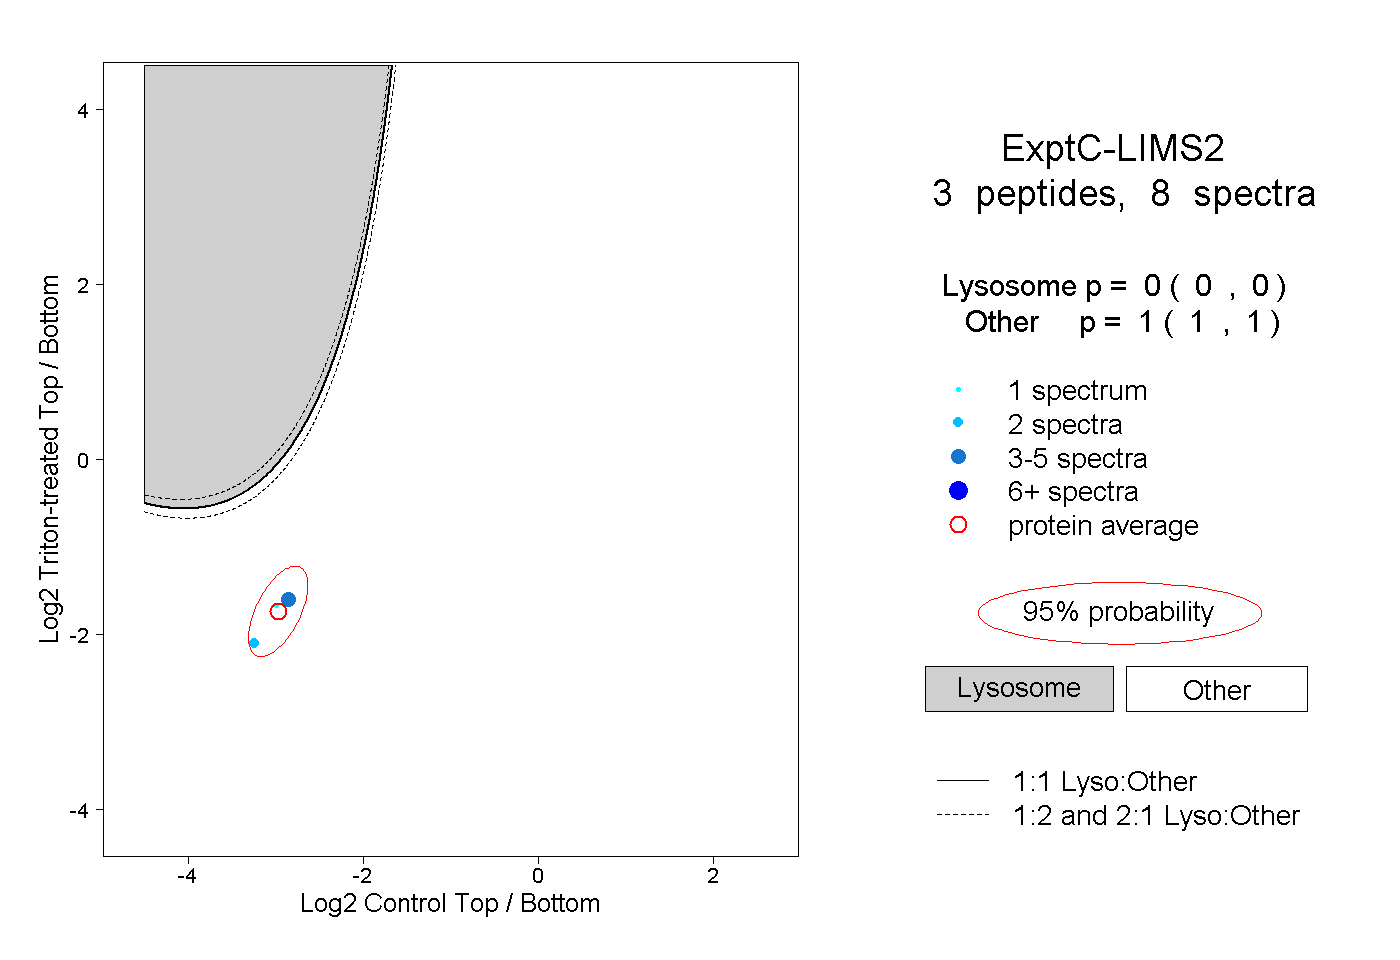 |
0.000 0.000 | 0.000 |
1.000 1.000 | 1.000 |