 4
4peptides
spectra
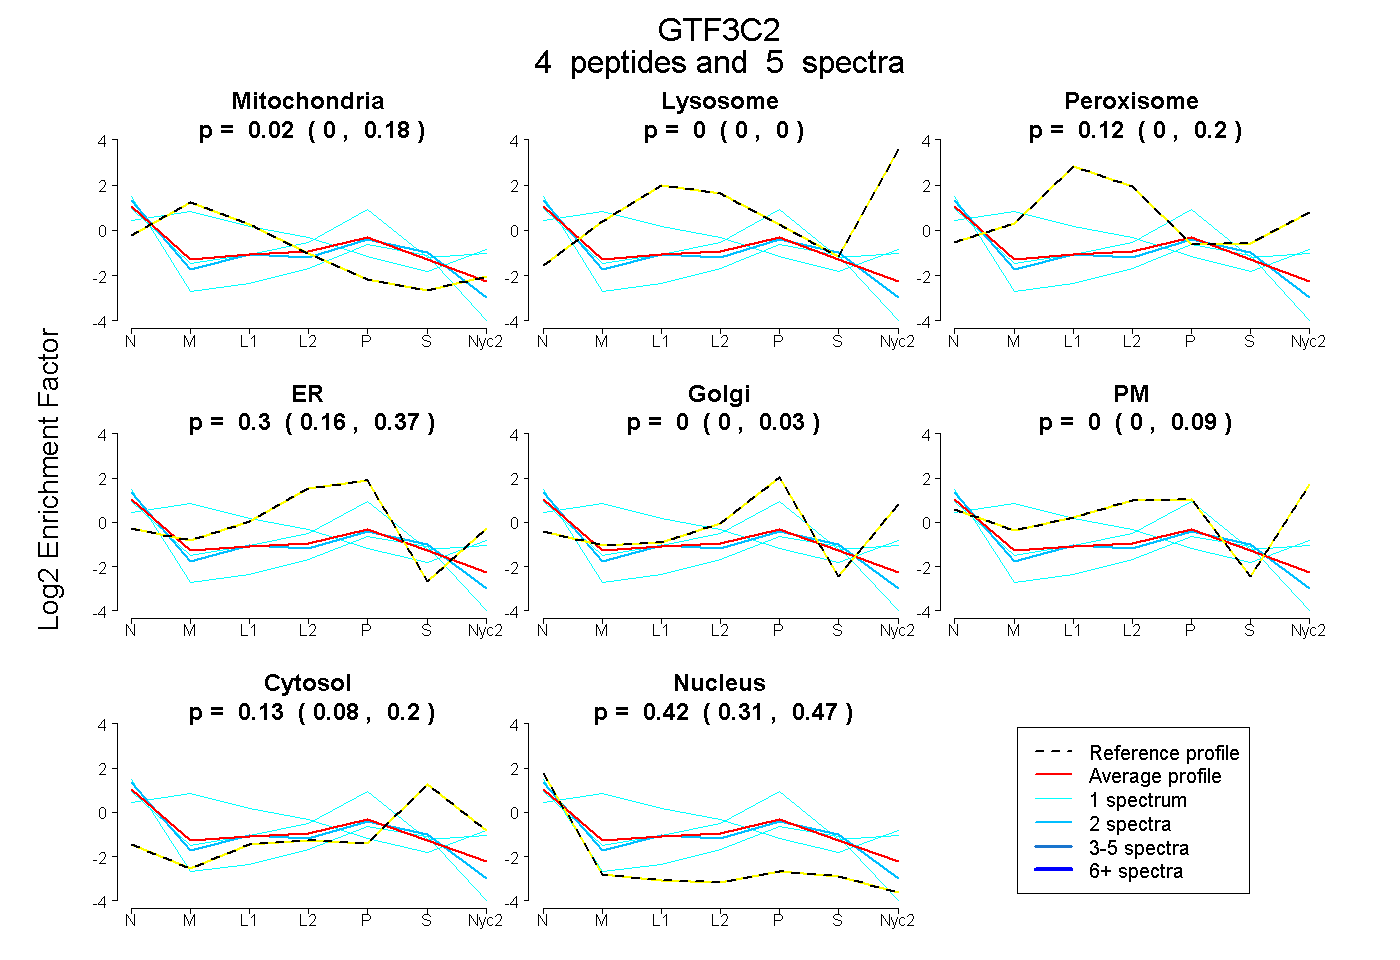
0.000 | 0.179
0.000 | 0.000
0.000 | 0.203
0.160 | 0.375
0.000 | 0.034
0.000 | 0.090
0.075 | 0.196
0.308 | 0.466
| Plot | Mito | Lyso | Perox | ER | Golgi | PM | Cytosol | Nucleus | |||||
| Expt A |
4 peptides |
5 spectra |
|
0.022 0.000 | 0.179 |
0.000 0.000 | 0.000 |
0.120 0.000 | 0.203 |
0.300 0.160 | 0.375 |
0.000 0.000 | 0.034 |
0.000 0.000 | 0.090 |
0.135 0.075 | 0.196 |
0.423 0.308 | 0.466 |