 4
4peptides
spectra
0.000 | 0.179
0.000 | 0.000
0.000 | 0.203
0.160 | 0.375
0.000 | 0.034
0.000 | 0.090
0.075 | 0.196
0.308 | 0.466
| Plot | Mito | Lyso | Perox | ER | Golgi | PM | Cytosol | Nucleus | |||||
| Expt A |
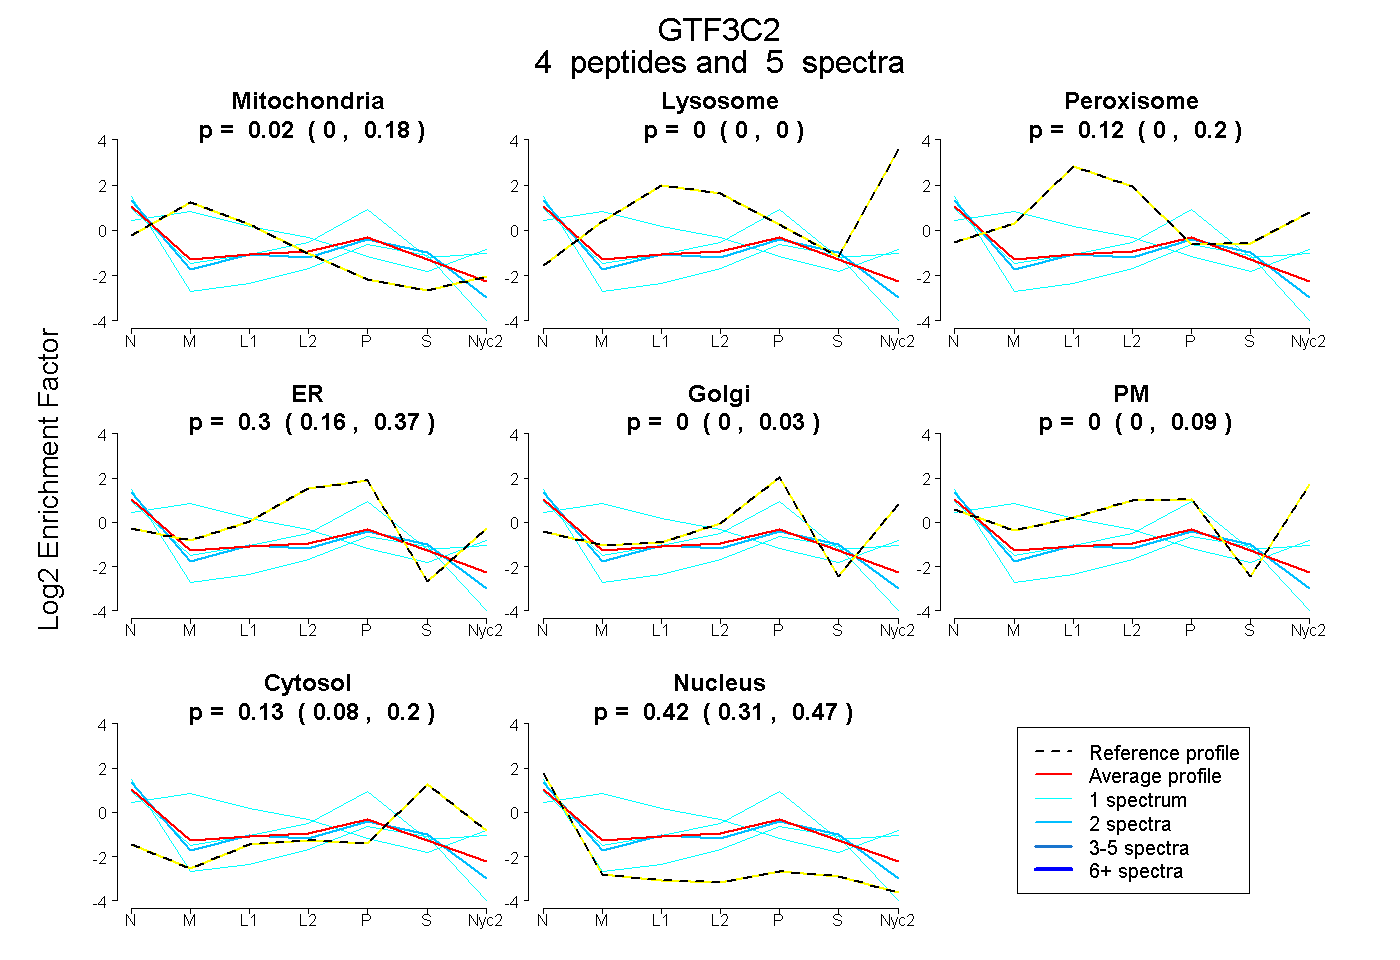
4 peptides |
5 spectra |
|
0.022 0.000 | 0.179 |
0.000 0.000 | 0.000 |
0.120 0.000 | 0.203 |
0.300 0.160 | 0.375 |
0.000 0.000 | 0.034 |
0.000 0.000 | 0.090 |
0.135 0.075 | 0.196 |
0.423 0.308 | 0.466 |
| 2 spectra, SPLFSVQR | 0.000 | 0.000 | 0.113 | 0.236 | 0.000 | 0.000 | 0.153 | 0.498 | ||
| 1 spectrum, EGIPEDGTIYR | 0.000 | 0.000 | 0.000 | 0.159 | 0.000 | 0.000 | 0.181 | 0.660 | ||
| 1 spectrum, GPAAGK | 0.000 | 0.000 | 0.000 | 0.321 | 0.212 | 0.068 | 0.174 | 0.225 | ||
| 1 spectrum, RPYEPINCIK | 0.586 | 0.000 | 0.098 | 0.000 | 0.000 | 0.246 | 0.047 | 0.024 |