 19
19peptides
spectra
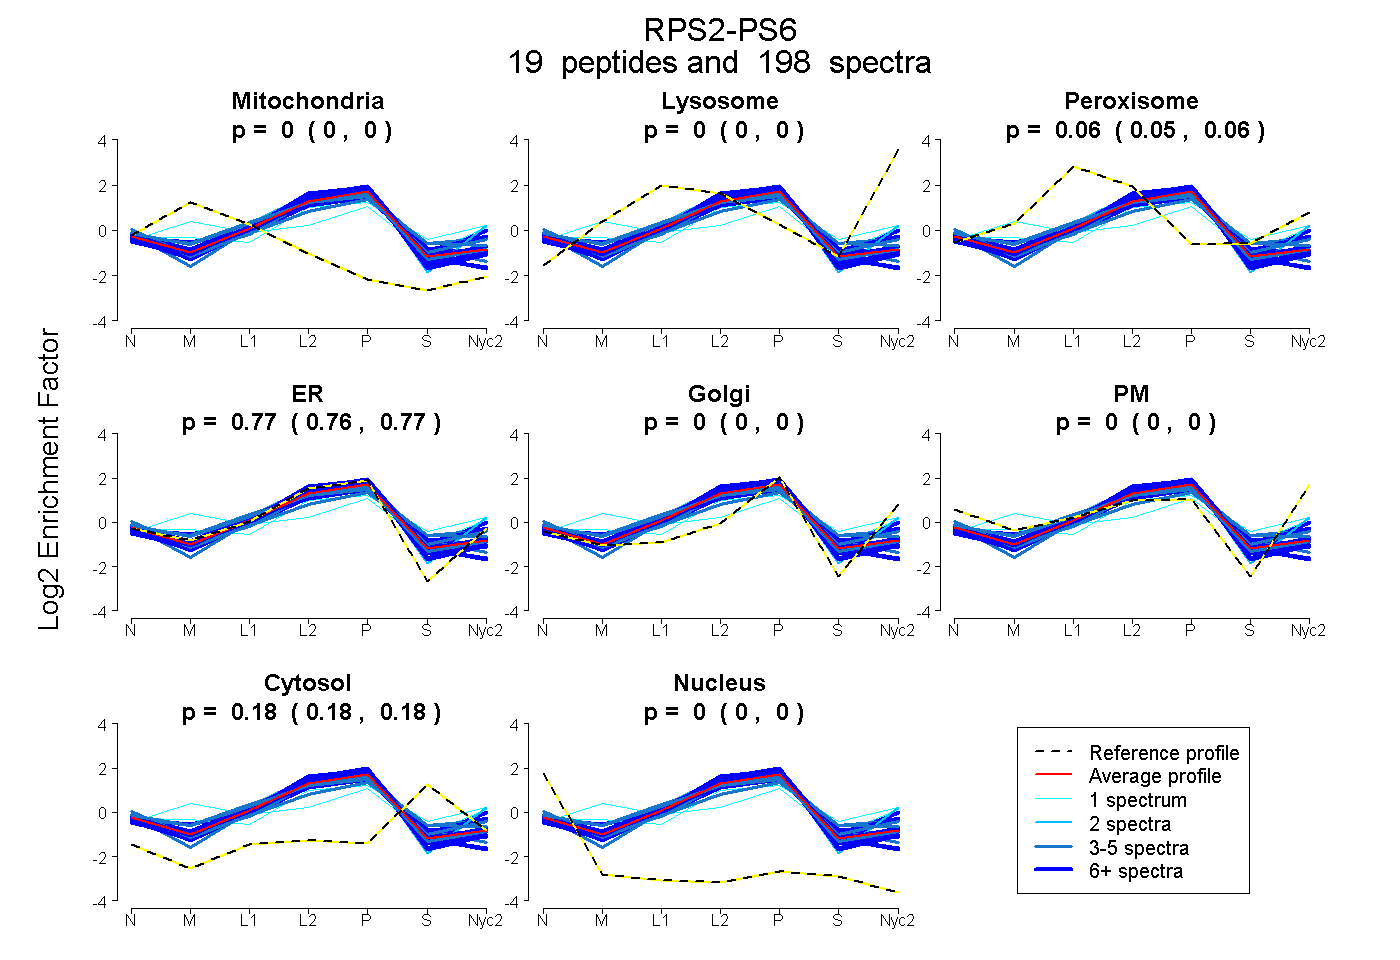
0.000 | 0.000
0.000 | 0.000
0.054 | 0.057
0.764 | 0.768
0.000 | 0.000
0.000 | 0.000
0.177 | 0.180
0.000 | 0.000
15peptides
spectra
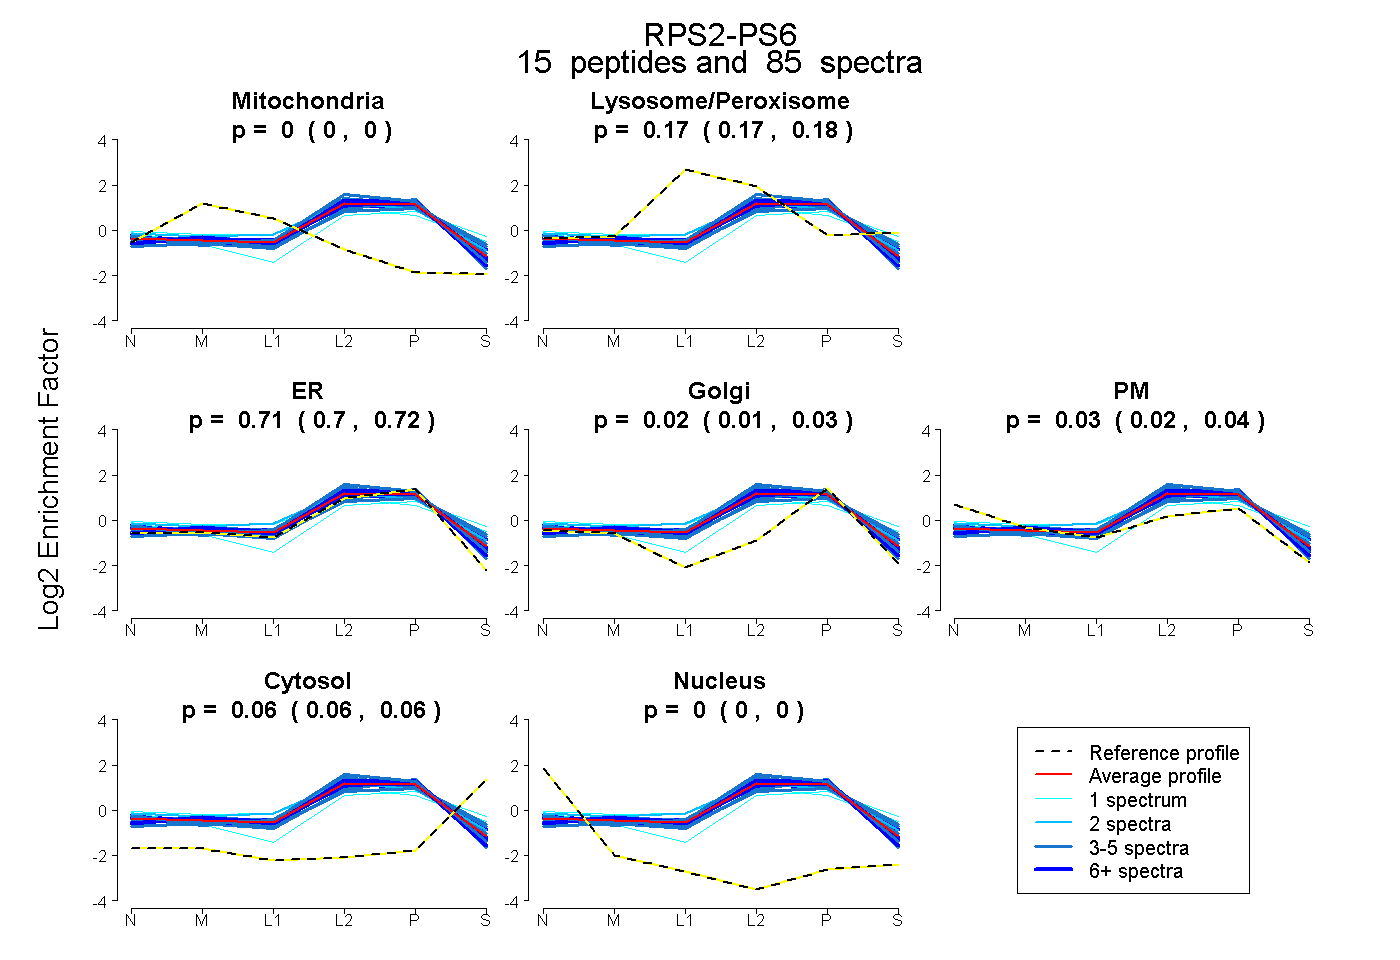
0.000 | 0.000
0.166 | 0.176
0.703 | 0.725
0.008 | 0.032
0.024 | 0.040
0.057 | 0.062
0.000 | 0.000
12peptides
spectra
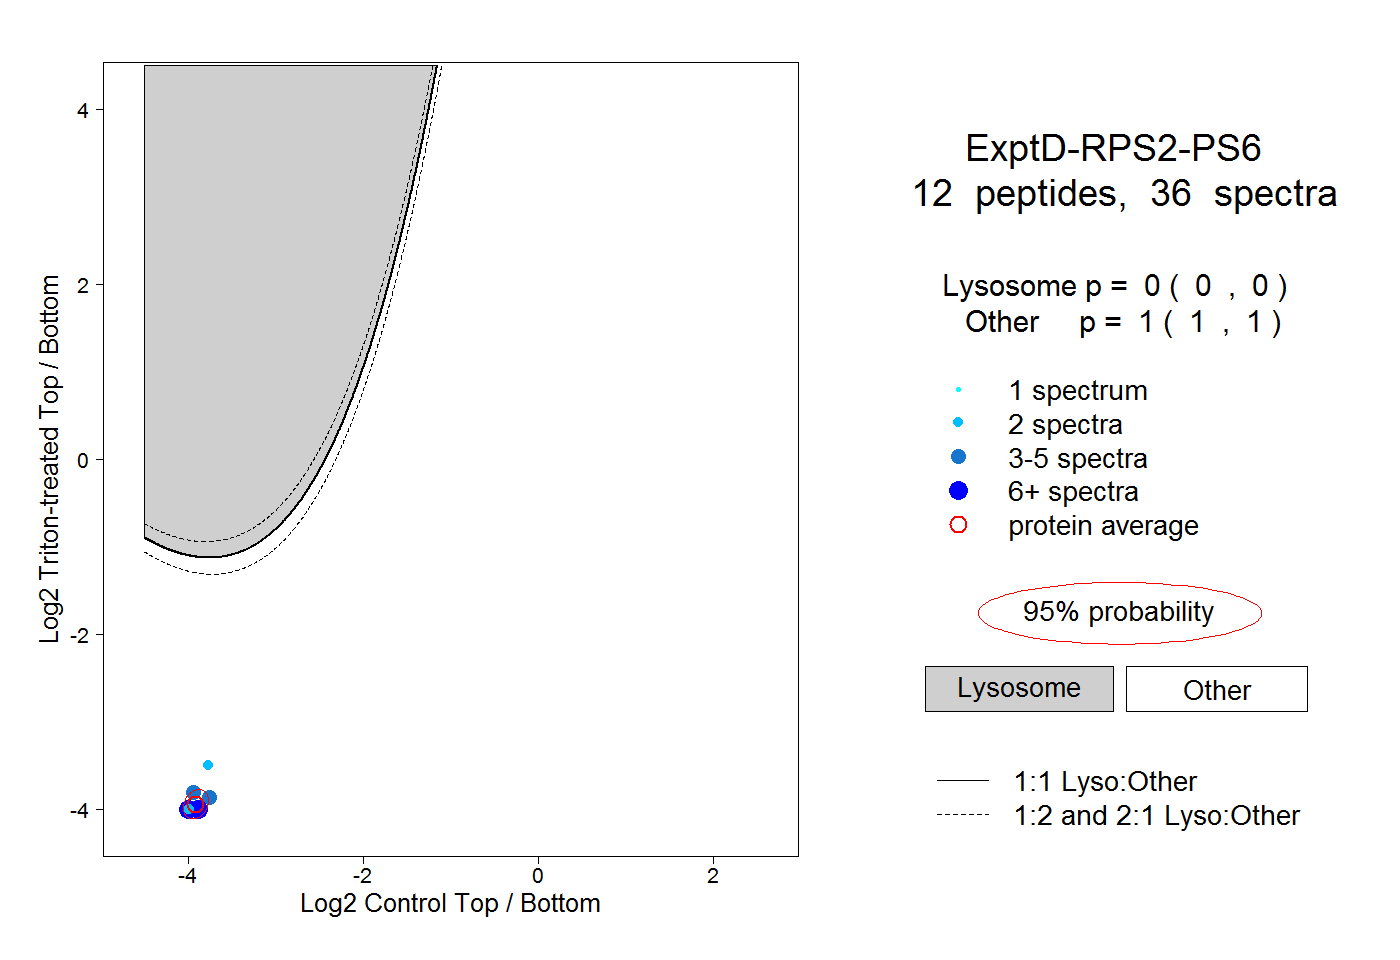
0.000 | 0.000
1.000 | 1.000