 11
11peptides
spectra
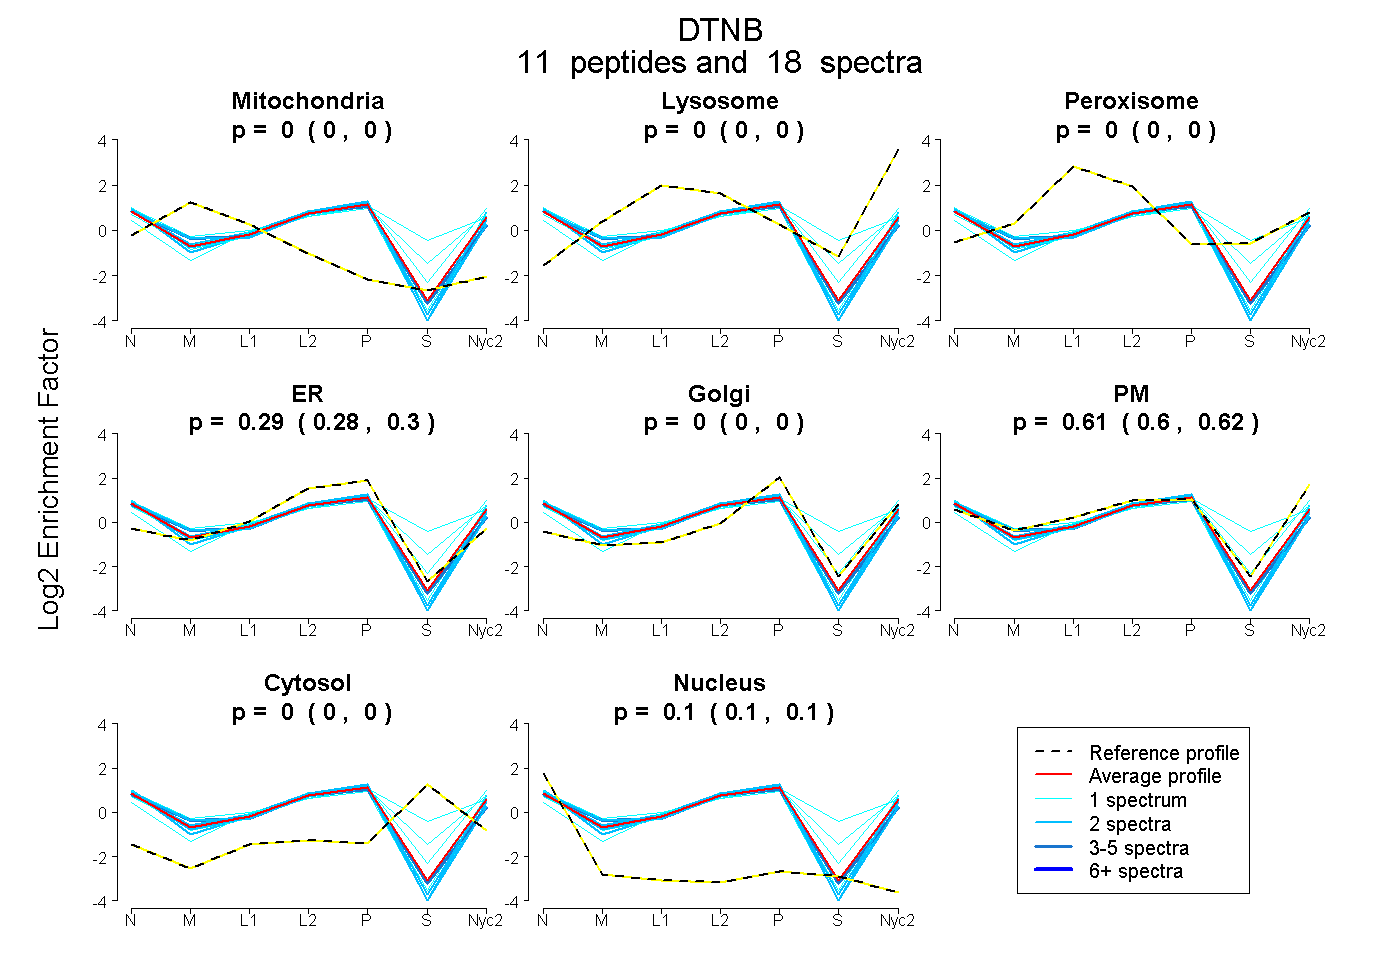
0.000 | 0.000
0.000 | 0.000
0.000 | 0.000
0.278 | 0.300
0.000 | 0.000
0.597 | 0.622
0.000 | 0.000
0.096 | 0.101
2peptides
spectra
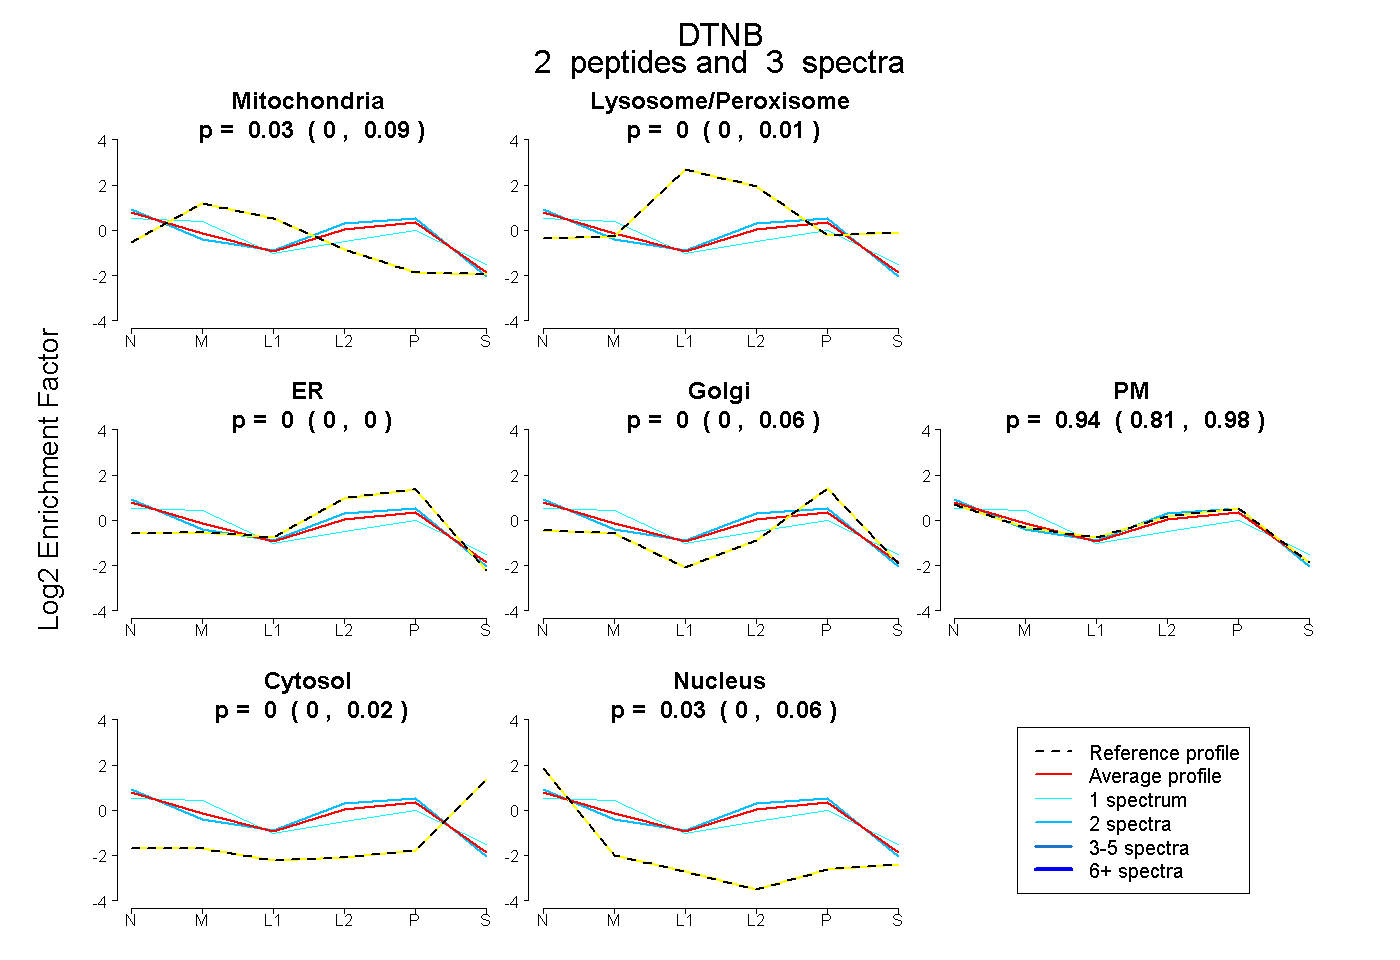
0.000 | 0.090
0.000 | 0.005
0.000 | 0.003
0.000 | 0.065
0.805 | 0.982
0.000 | 0.023
0.000 | 0.063
7peptides
spectra
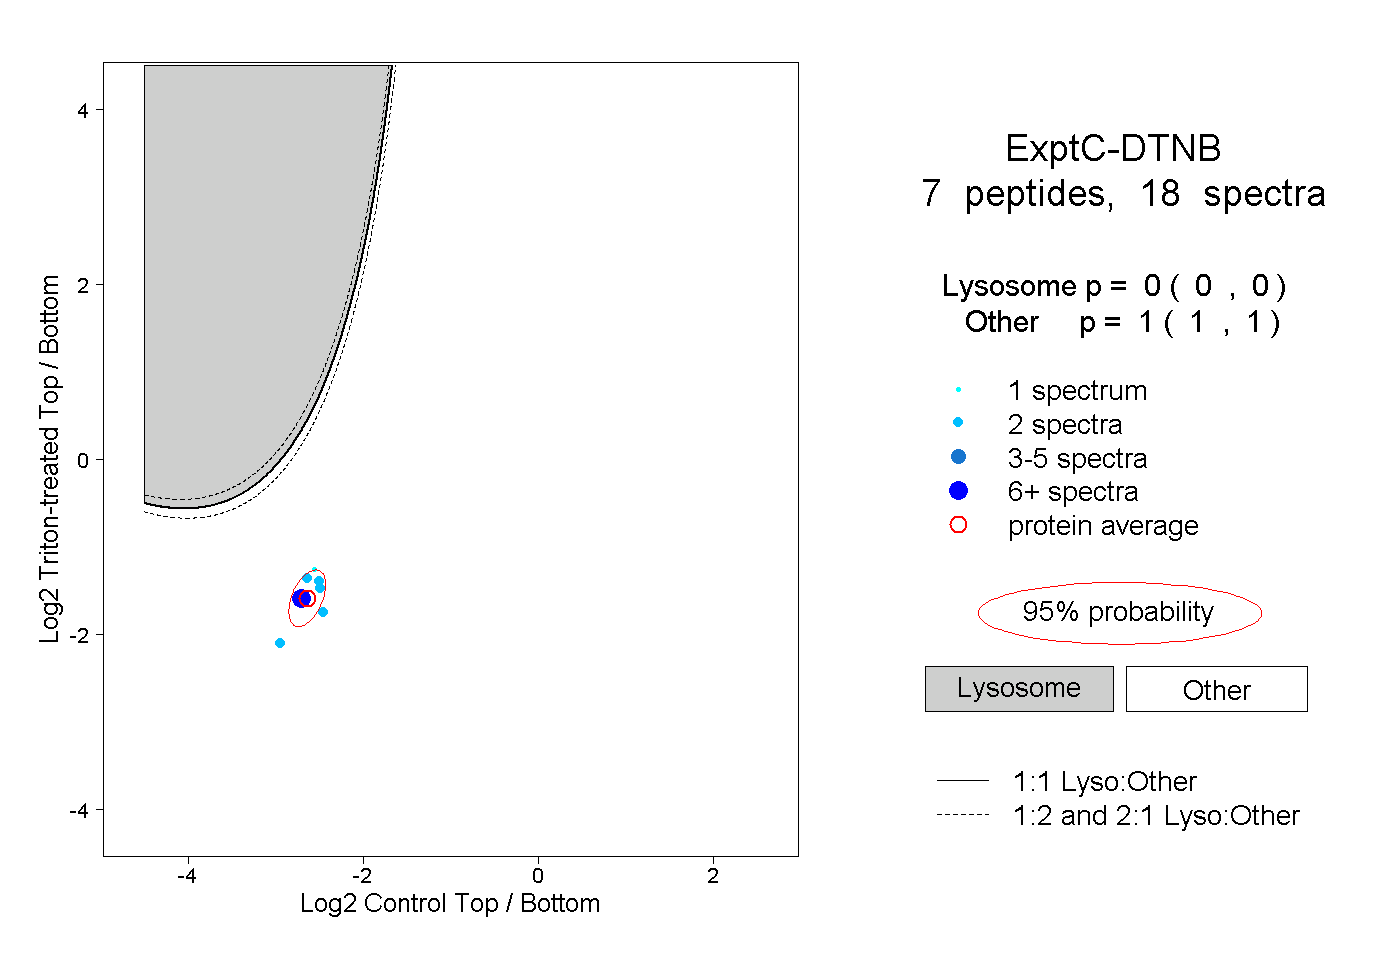
0.000 | 0.000
1.000 | 1.000