 11
11peptides
spectra
0.000 | 0.000
0.000 | 0.000
0.000 | 0.000
0.278 | 0.300
0.000 | 0.000
0.597 | 0.622
0.000 | 0.000
0.096 | 0.101
| Plot | Mito | Lyso | Perox | ER | Golgi | PM | Cytosol | Nucleus | |||||
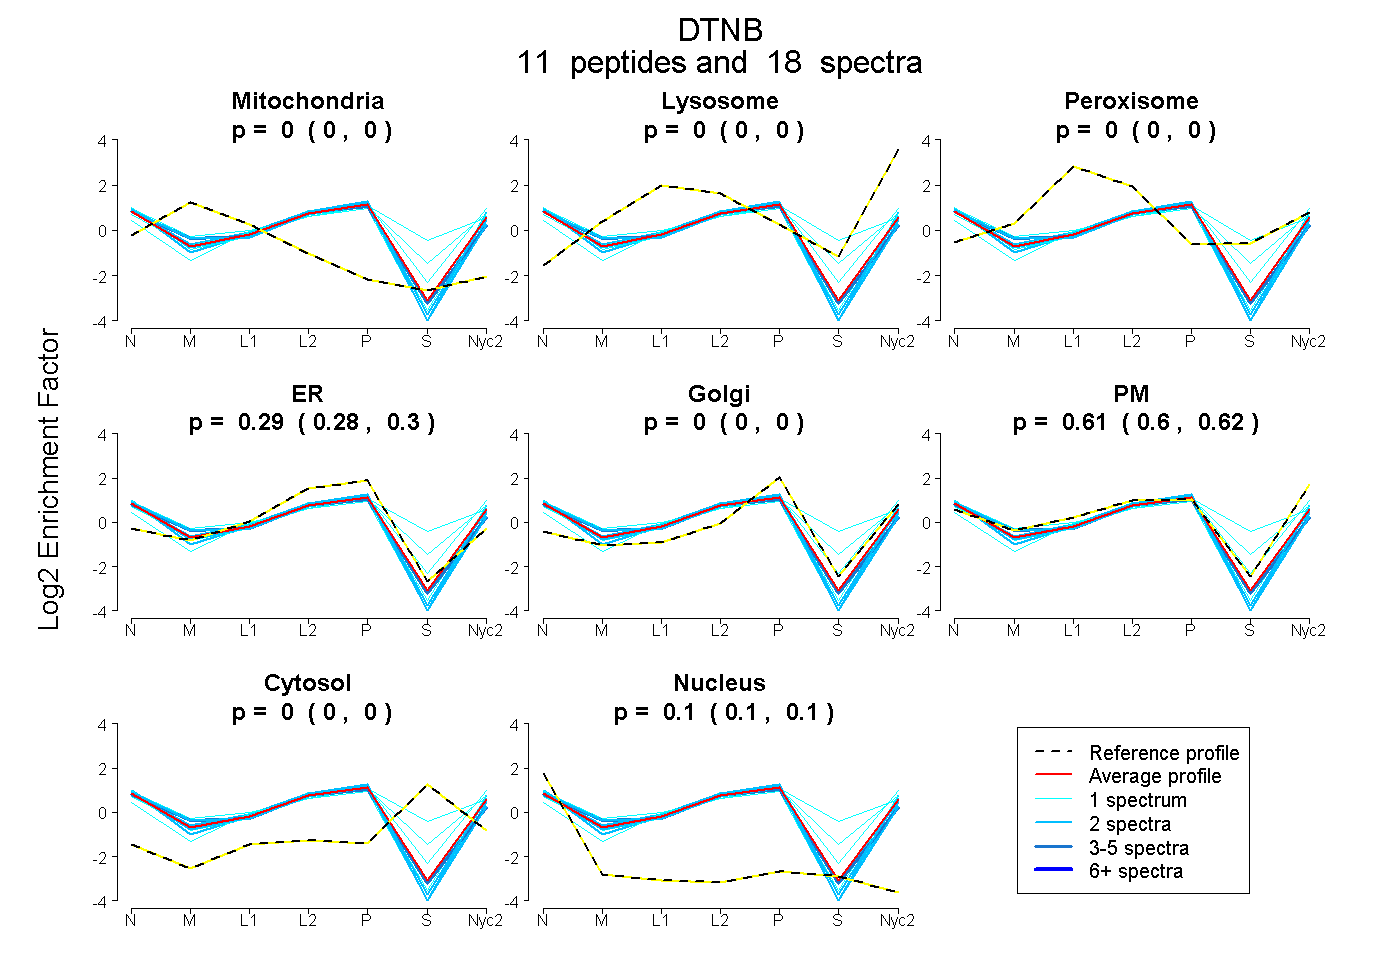
| Expt A |
11 peptides |
18 spectra |
|
0.000 0.000 | 0.000 |
0.000 0.000 | 0.000 |
0.000 0.000 | 0.000 |
0.290 0.278 | 0.300 |
0.000 0.000 | 0.000 |
0.611 0.597 | 0.622 |
0.000 0.000 | 0.000 |
0.099 0.096 | 0.101 |
| 1 spectrum, MSALQESR | 0.000 | 0.000 | 0.000 | 0.156 | 0.035 | 0.744 | 0.000 | 0.064 | ||
| 1 spectrum, EILQEIQR | 0.051 | 0.000 | 0.000 | 0.202 | 0.000 | 0.666 | 0.000 | 0.081 | ||
| 2 spectra, VLDSPSR | 0.000 | 0.000 | 0.000 | 0.312 | 0.000 | 0.593 | 0.000 | 0.095 | ||
| 1 spectrum, LSHAISK | 0.000 | 0.000 | 0.000 | 0.142 | 0.000 | 0.683 | 0.159 | 0.016 | ||
| 1 spectrum, LEHEQASQPTPEK | 0.000 | 0.000 | 0.049 | 0.174 | 0.000 | 0.477 | 0.300 | 0.000 | ||
| 2 spectra, TCFPQQK | 0.015 | 0.000 | 0.000 | 0.363 | 0.000 | 0.511 | 0.000 | 0.111 | ||
| 2 spectra, LDEEHR | 0.000 | 0.000 | 0.000 | 0.268 | 0.000 | 0.648 | 0.000 | 0.084 | ||
| 3 spectra, SLGCVPSR | 0.041 | 0.000 | 0.000 | 0.361 | 0.000 | 0.501 | 0.000 | 0.097 | ||
| 1 spectrum, QLIAELENK | 0.000 | 0.000 | 0.000 | 0.243 | 0.000 | 0.659 | 0.000 | 0.098 | ||
| 2 spectra, AQQNPTLLAELR | 0.000 | 0.000 | 0.000 | 0.291 | 0.000 | 0.594 | 0.000 | 0.115 | ||
| 2 spectra, AQNFDVIR | 0.000 | 0.000 | 0.000 | 0.388 | 0.000 | 0.521 | 0.000 | 0.092 |
| Plot | Mito | Lyso or Perox | ER | Golgi | PM | Cytosol | Nucleus | ||||||
| Expt B |
2 peptides |
3 spectra |
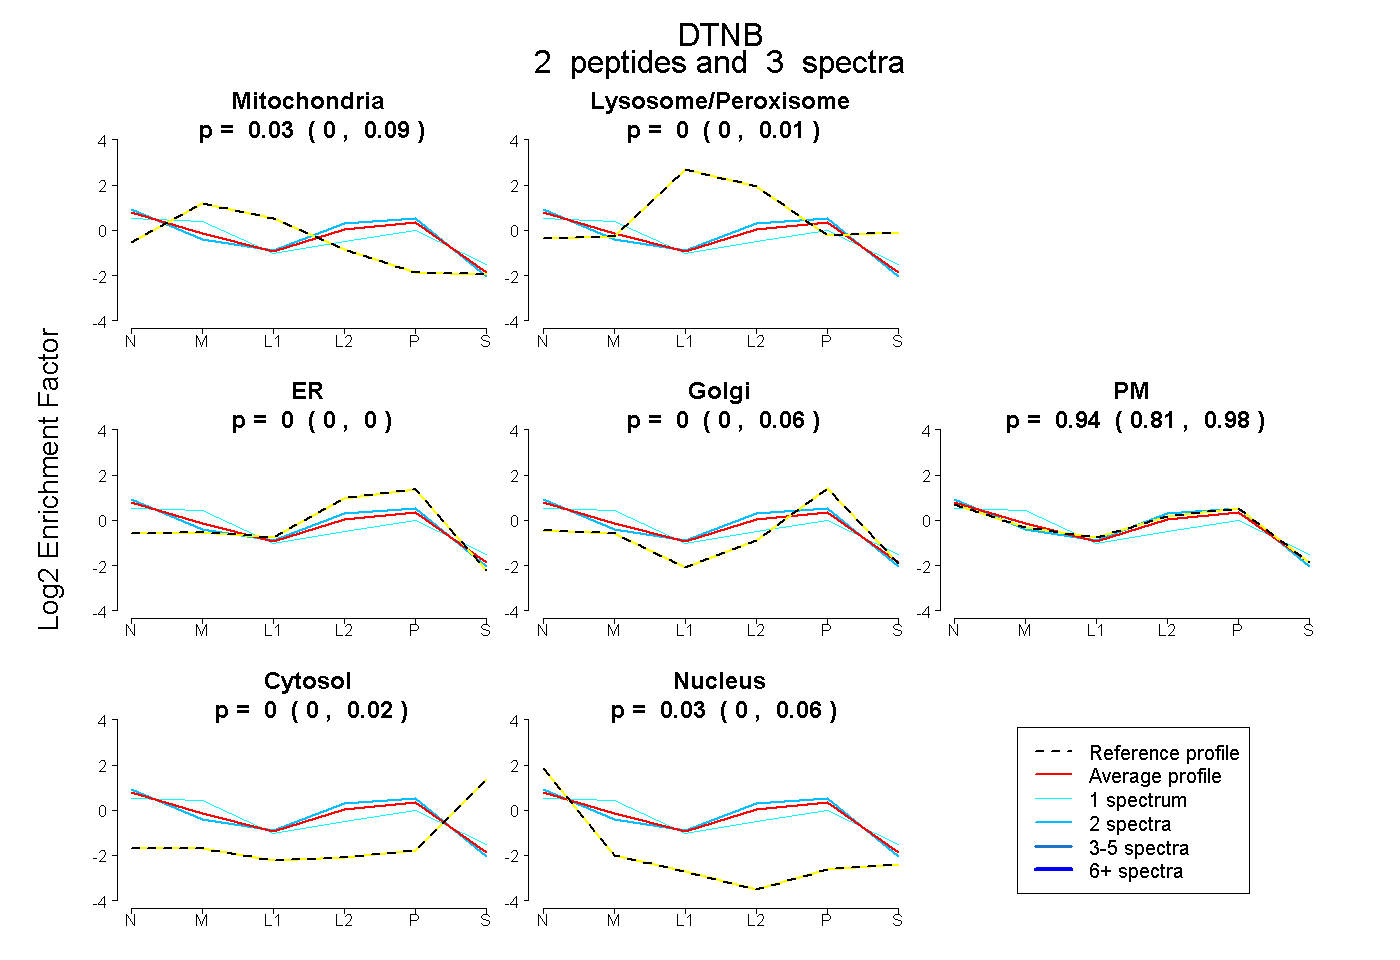 |
0.032 0.000 | 0.090 |
0.000 0.000 | 0.005 |
0.000 0.000 | 0.003 |
0.000 0.000 | 0.065 |
0.939 0.805 | 0.982 |
0.000 0.000 | 0.023 |
0.028 0.000 | 0.063 |
|||
| Plot | Lyso | Other | |||||||||||
| Expt C |
7 peptides |
18 spectra |
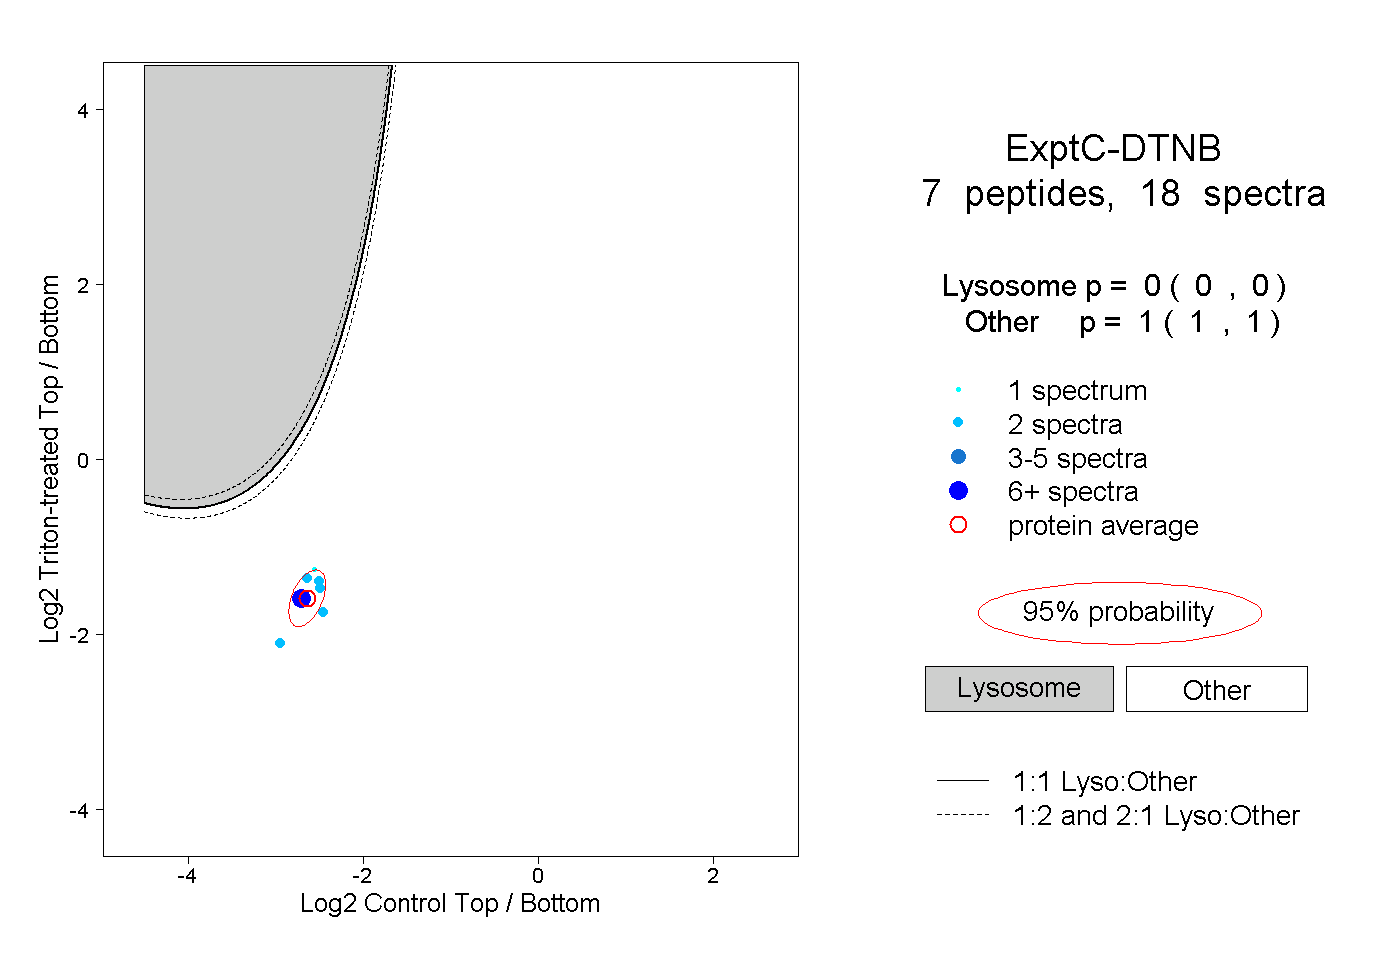 |
0.000 0.000 | 0.000 |
1.000 1.000 | 1.000 |