 11
11peptides
spectra
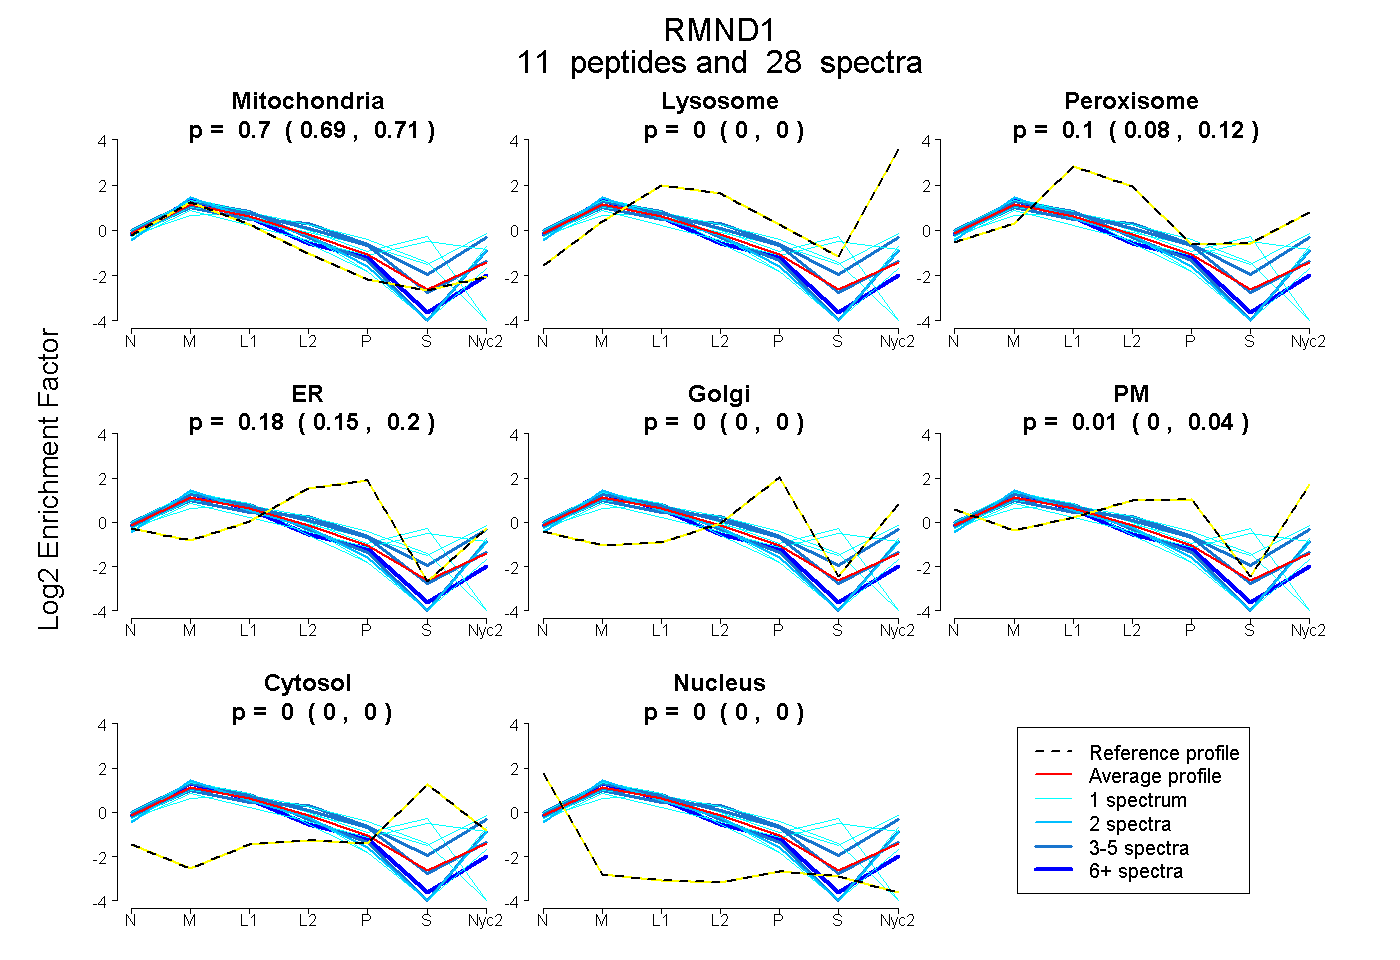
0.691 | 0.714
0.000 | 0.005
0.076 | 0.117
0.152 | 0.201
0.000 | 0.000
0.000 | 0.045
0.000 | 0.000
0.000 | 0.000
10peptides
spectra
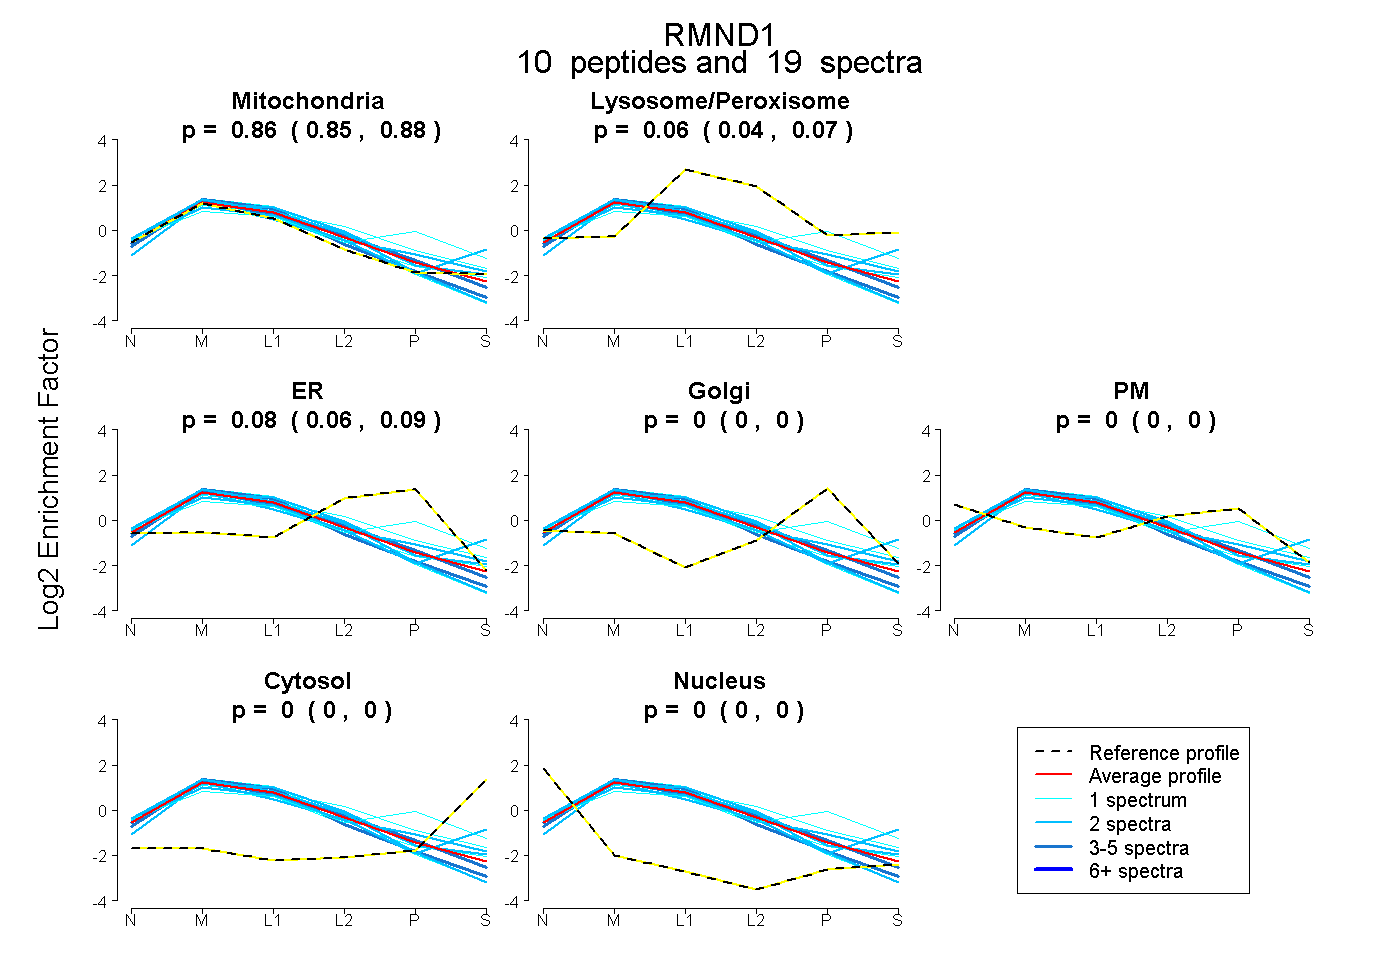
0.848 | 0.877
0.041 | 0.071
0.061 | 0.093
0.000 | 0.000
0.000 | 0.000
0.000 | 0.000
0.000 | 0.000
15peptides
spectra
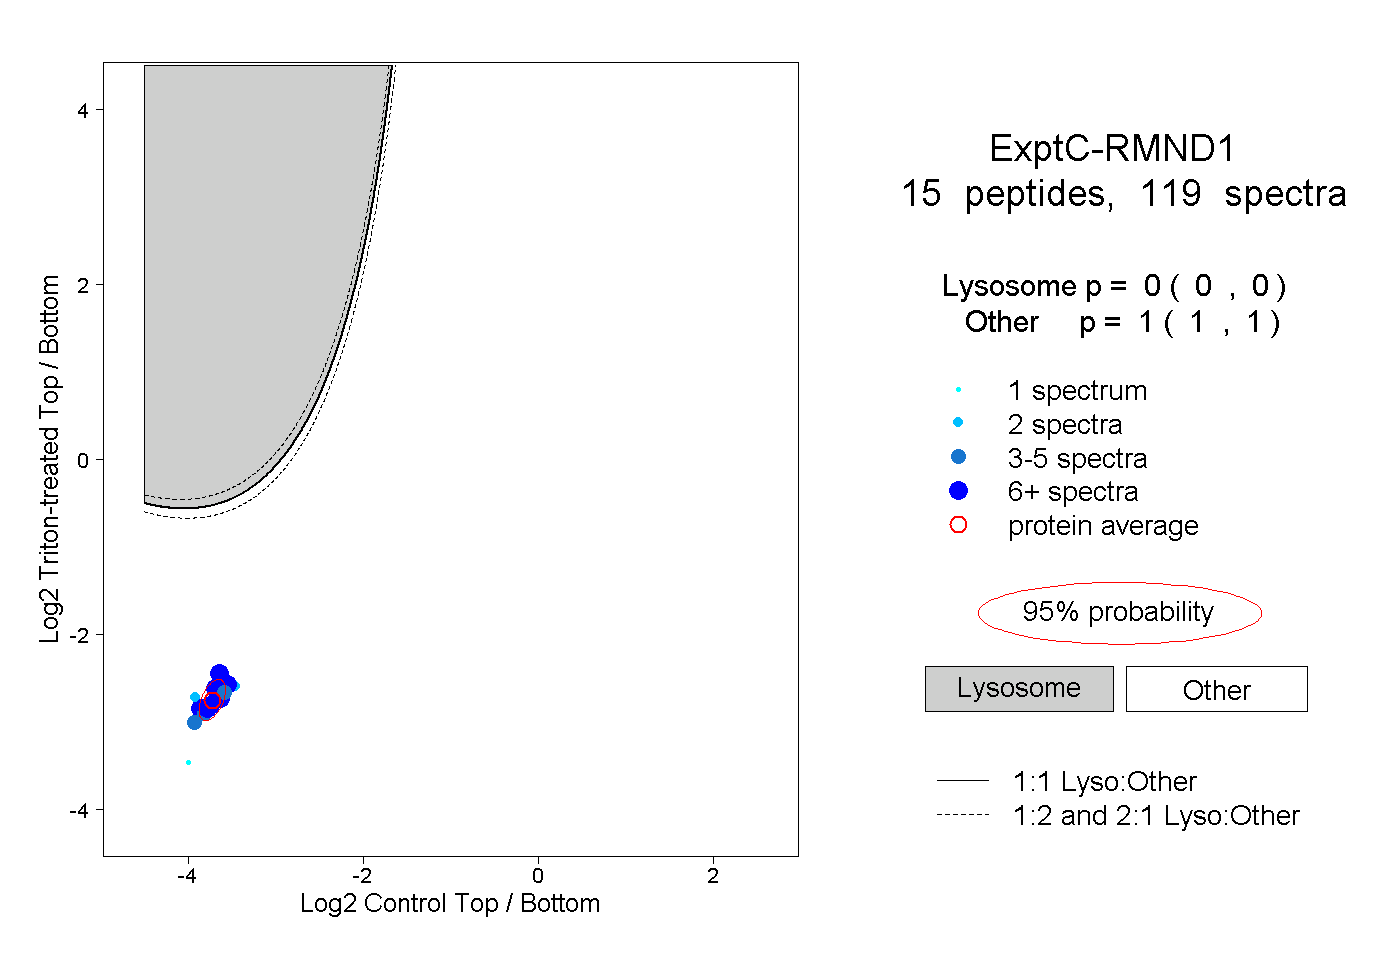
0.000 | 0.000
1.000 | 1.000
4peptides
spectra
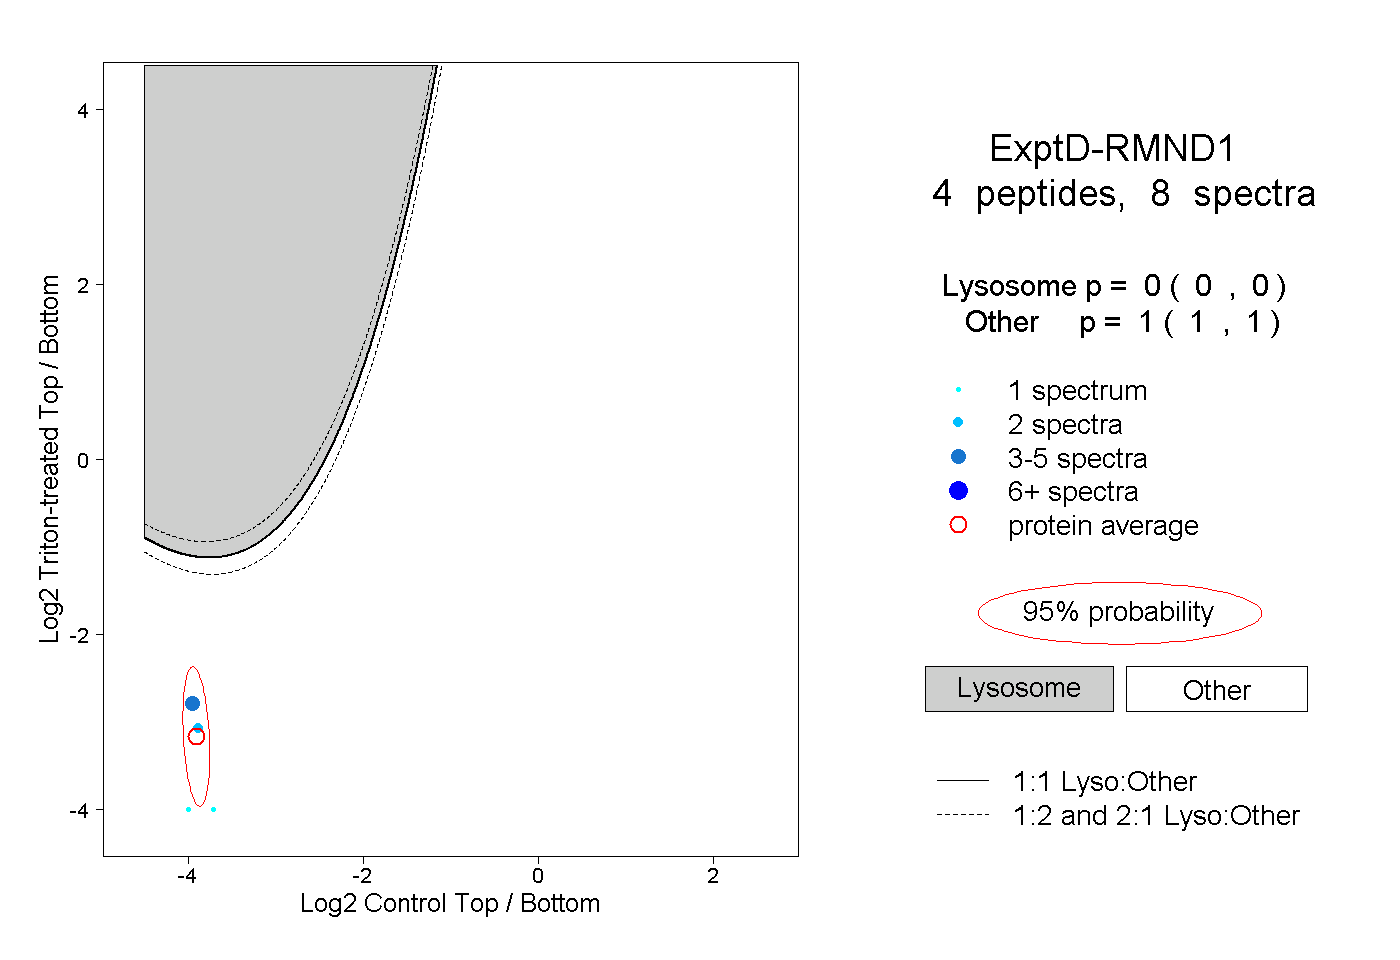
0.000 | 0.000
1.000 | 1.000