 11
11peptides
spectra
0.691 | 0.714
0.000 | 0.005
0.076 | 0.117
0.152 | 0.201
0.000 | 0.000
0.000 | 0.045
0.000 | 0.000
0.000 | 0.000
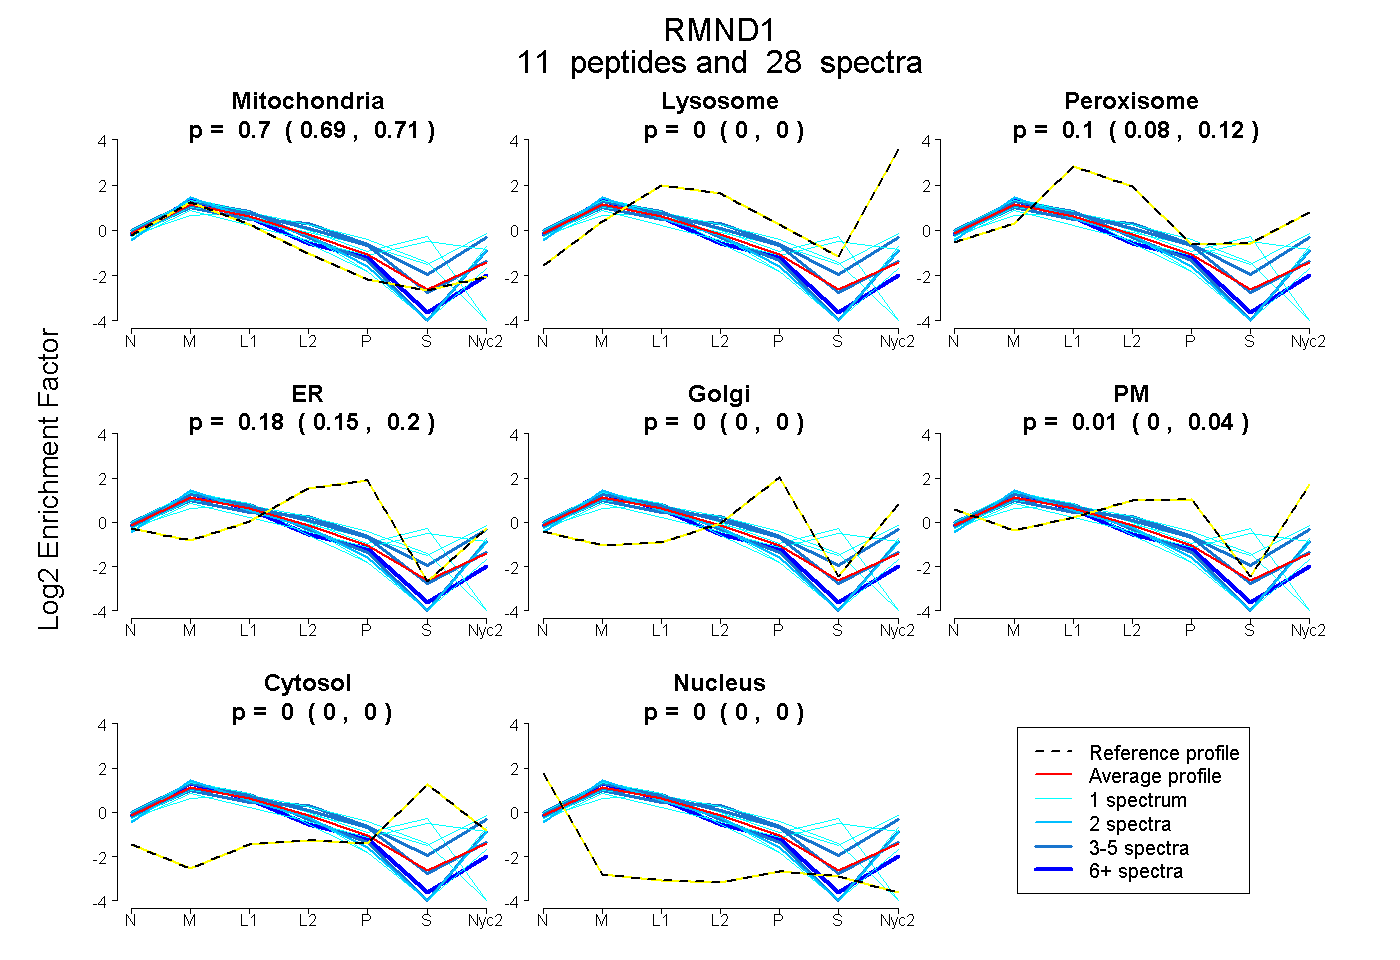
| Plot | Mito | Lyso | Perox | ER | Golgi | PM | Cytosol | Nucleus | |||||
| Expt A |
11 peptides |
28 spectra |
|
0.704 0.691 | 0.714 |
0.000 0.000 | 0.005 |
0.099 0.076 | 0.117 |
0.184 0.152 | 0.201 |
0.000 0.000 | 0.000 |
0.014 0.000 | 0.045 |
0.000 0.000 | 0.000 |
0.000 0.000 | 0.000 |
| 2 spectra, MGELFALR | 0.790 | 0.058 | 0.000 | 0.000 | 0.000 | 0.153 | 0.000 | 0.000 | ||
| 1 spectrum, EGAAVFWNVK | 0.780 | 0.097 | 0.000 | 0.000 | 0.000 | 0.123 | 0.000 | 0.000 | ||
| 1 spectrum, DAANILVMGVESSAK | 0.663 | 0.000 | 0.119 | 0.010 | 0.000 | 0.000 | 0.208 | 0.000 | ||
| 1 spectrum, FIESIQSIPEALK | 0.482 | 0.097 | 0.122 | 0.000 | 0.000 | 0.240 | 0.058 | 0.000 | ||
| 8 spectra, ANLEELYDK | 0.831 | 0.000 | 0.000 | 0.169 | 0.000 | 0.000 | 0.000 | 0.000 | ||
| 1 spectrum, LNSELDLDDSILEK | 0.742 | 0.000 | 0.006 | 0.235 | 0.000 | 0.000 | 0.016 | 0.000 | ||
| 1 spectrum, LAIWEATLDK | 0.477 | 0.035 | 0.236 | 0.000 | 0.010 | 0.000 | 0.243 | 0.000 | ||
| 1 spectrum, INLSSDFLITPDFYWDR | 0.900 | 0.000 | 0.000 | 0.030 | 0.000 | 0.070 | 0.000 | 0.000 | ||
| 3 spectra, EGDAGTIFLFR | 0.738 | 0.000 | 0.000 | 0.000 | 0.000 | 0.262 | 0.000 | 0.000 | ||
| 5 spectra, LQHCMELTDLMR | 0.630 | 0.000 | 0.097 | 0.273 | 0.000 | 0.000 | 0.000 | 0.000 | ||
| 4 spectra, HVMQVLER | 0.509 | 0.103 | 0.114 | 0.081 | 0.000 | 0.193 | 0.000 | 0.000 |
| Plot | Mito | Lyso or Perox | ER | Golgi | PM | Cytosol | Nucleus | ||||||
| Expt B |
10 peptides |
19 spectra |
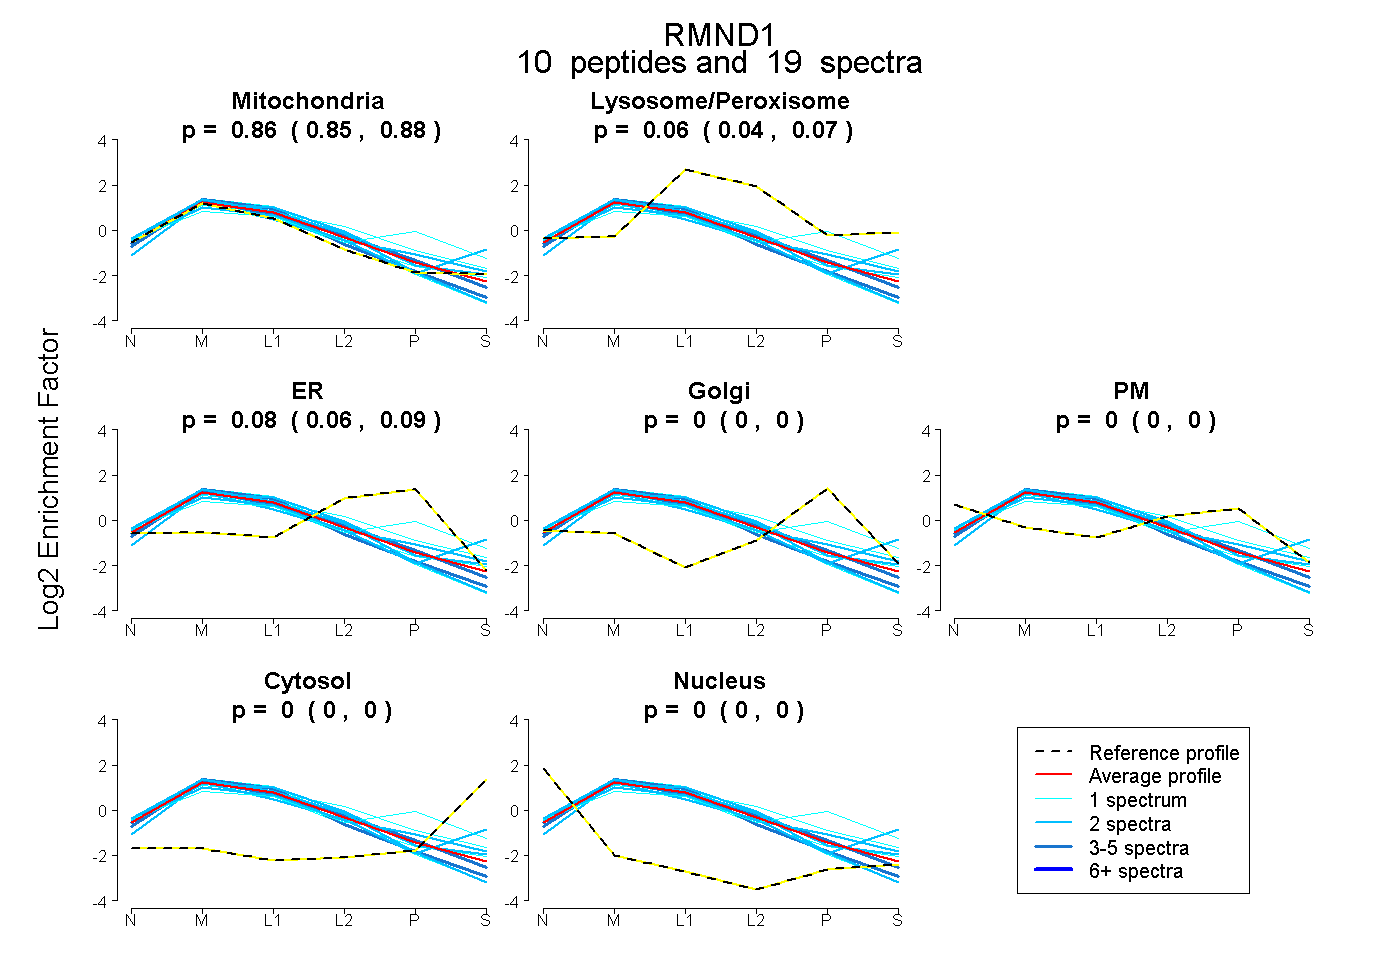 |
0.864 0.848 | 0.877 |
0.057 0.041 | 0.071 |
0.078 0.061 | 0.093 |
0.000 0.000 | 0.000 |
0.000 0.000 | 0.000 |
0.000 0.000 | 0.000 |
0.000 0.000 | 0.000 |
|||
| Plot | Lyso | Other | |||||||||||
| Expt C |
15 peptides |
119 spectra |
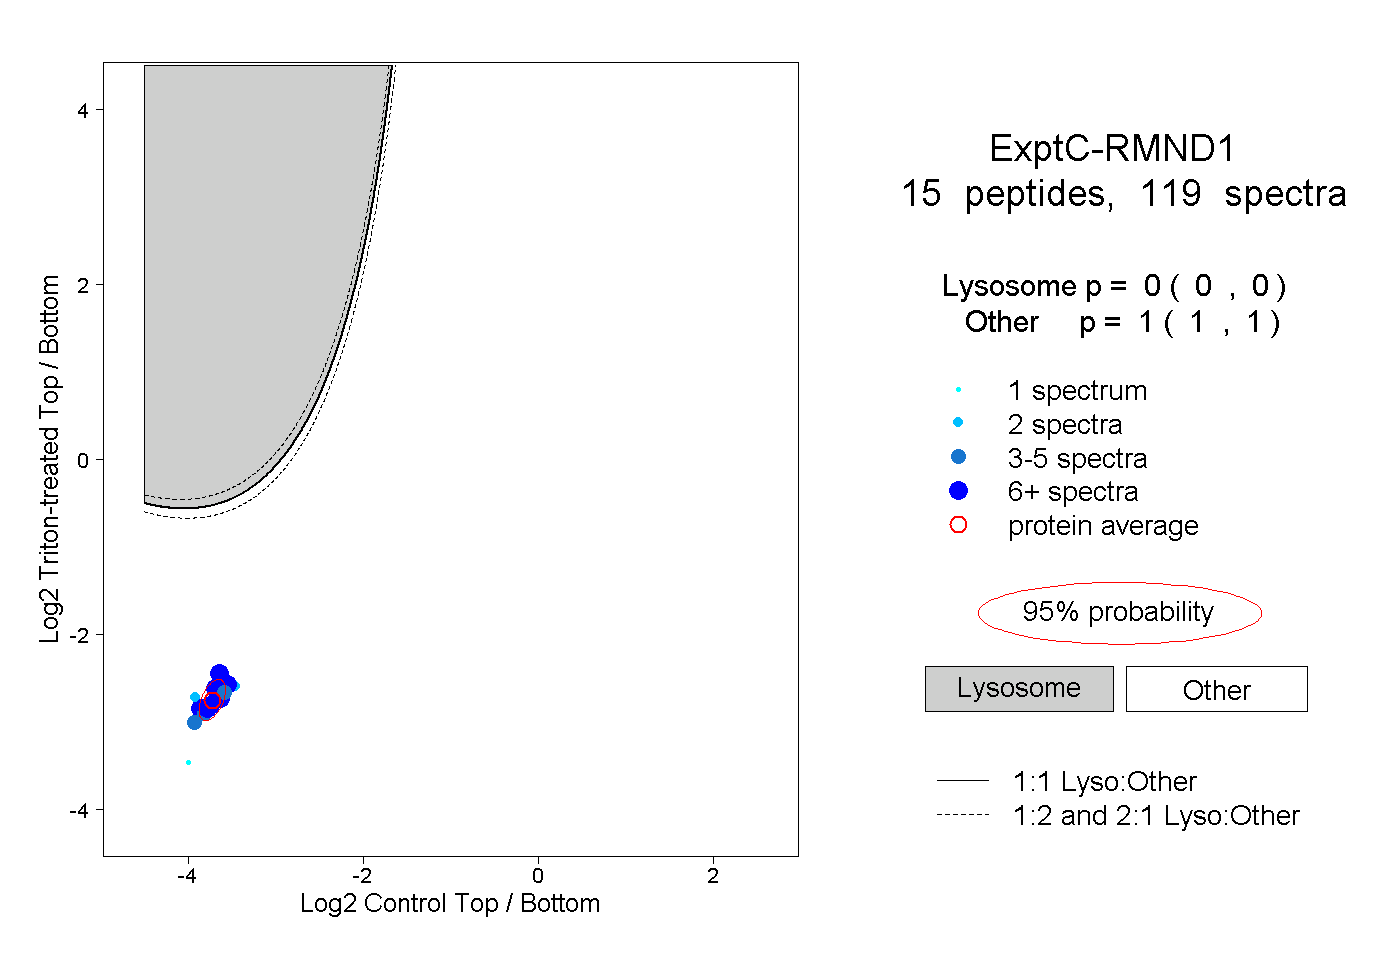 |
0.000 0.000 | 0.000 |
1.000 1.000 | 1.000 |
||||||||
| Plot | Lyso | Other | |||||||||||
| Expt D |
4 peptides |
8 spectra |
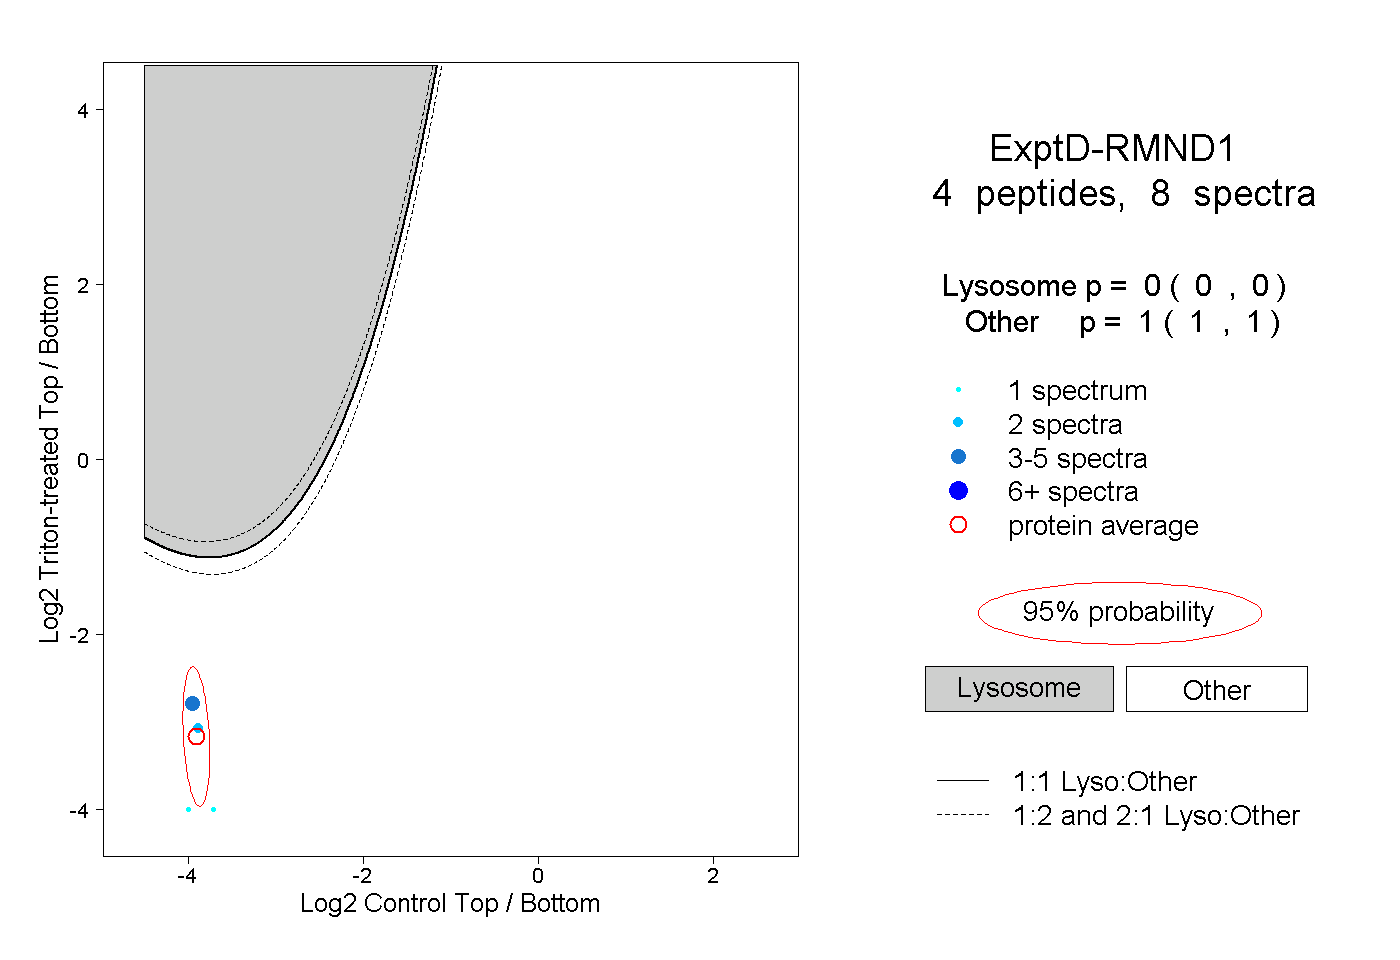 |
0.000 0.000 | 0.000 |
1.000 1.000 | 1.000 |