 15
15peptides
spectra
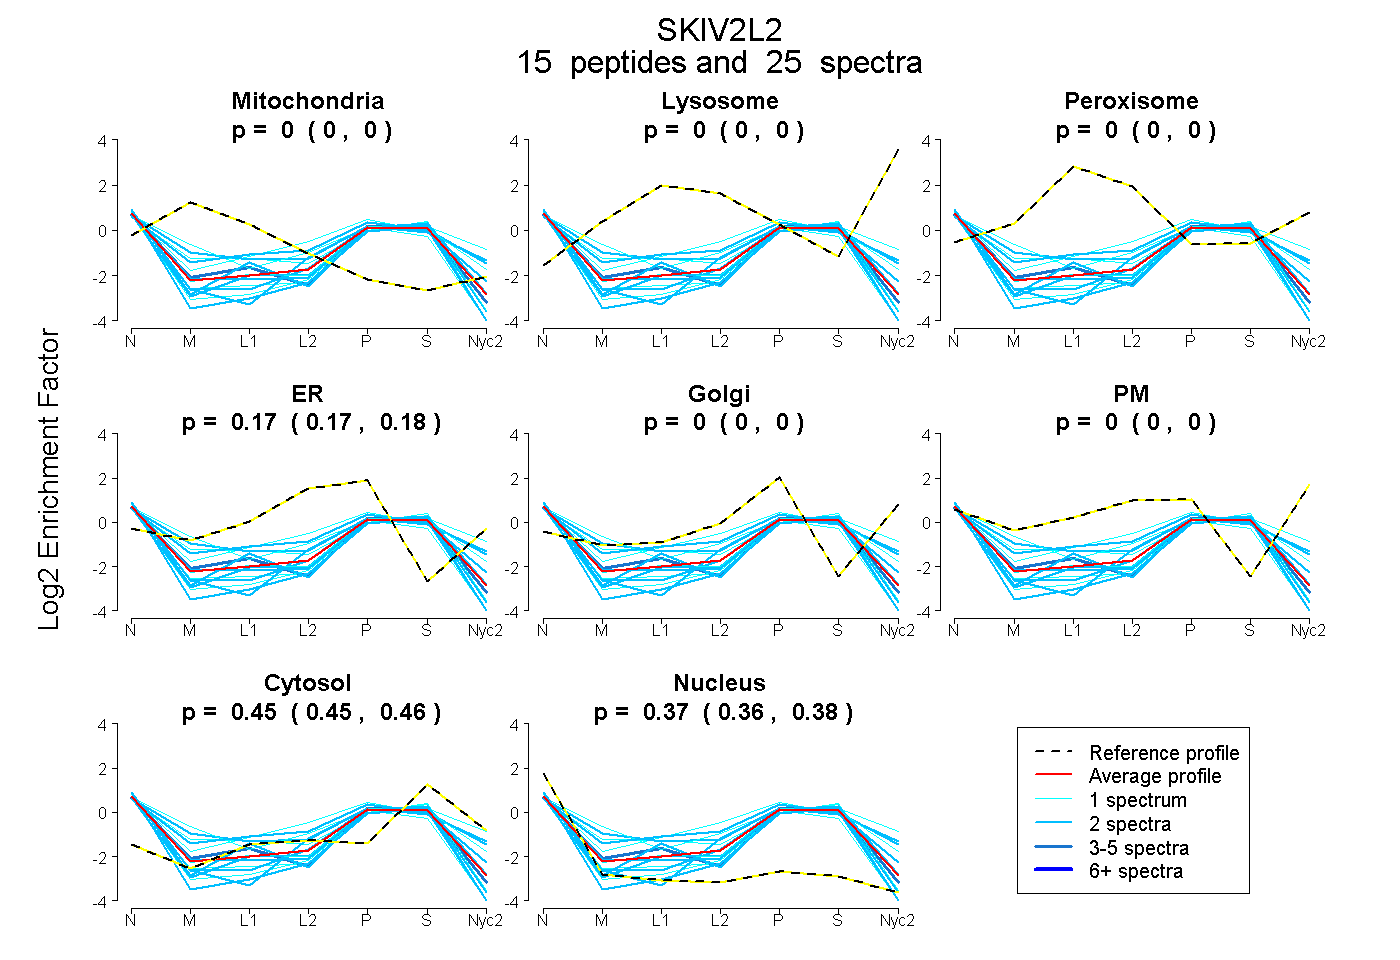
0.000 | 0.000
0.000 | 0.000
0.000 | 0.000
0.167 | 0.182
0.000 | 0.000
0.000 | 0.000
0.446 | 0.458
0.363 | 0.380
4peptides
spectra
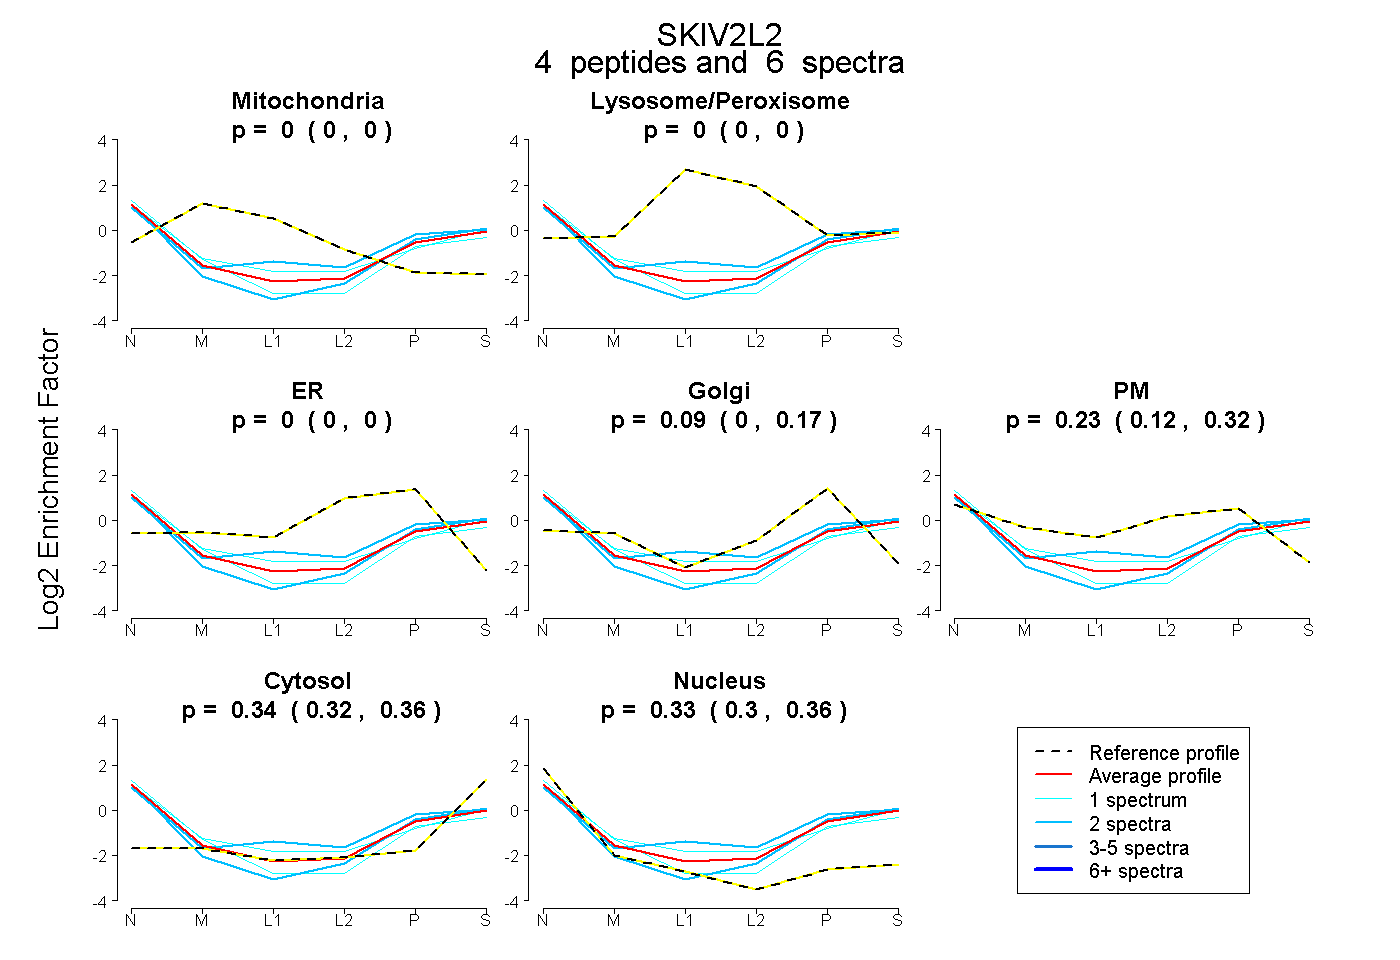
0.000 | 0.000
0.000 | 0.000
0.000 | 0.000
0.000 | 0.173
0.124 | 0.323
0.323 | 0.359
0.301 | 0.361
1peptide
spectrum
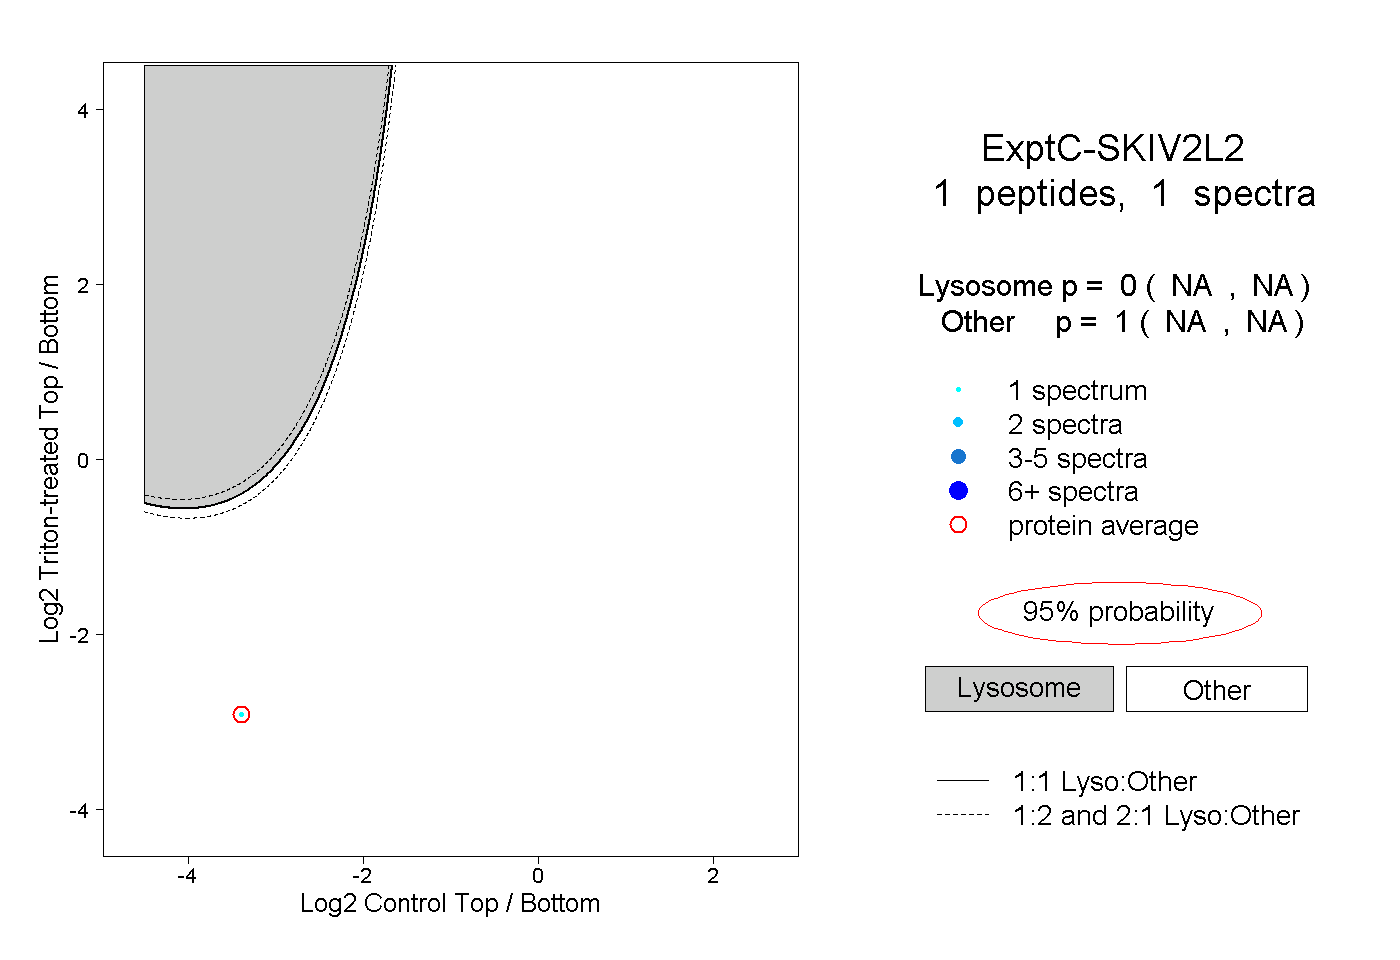
NA | NA
NA | NA