 15
15peptides
spectra
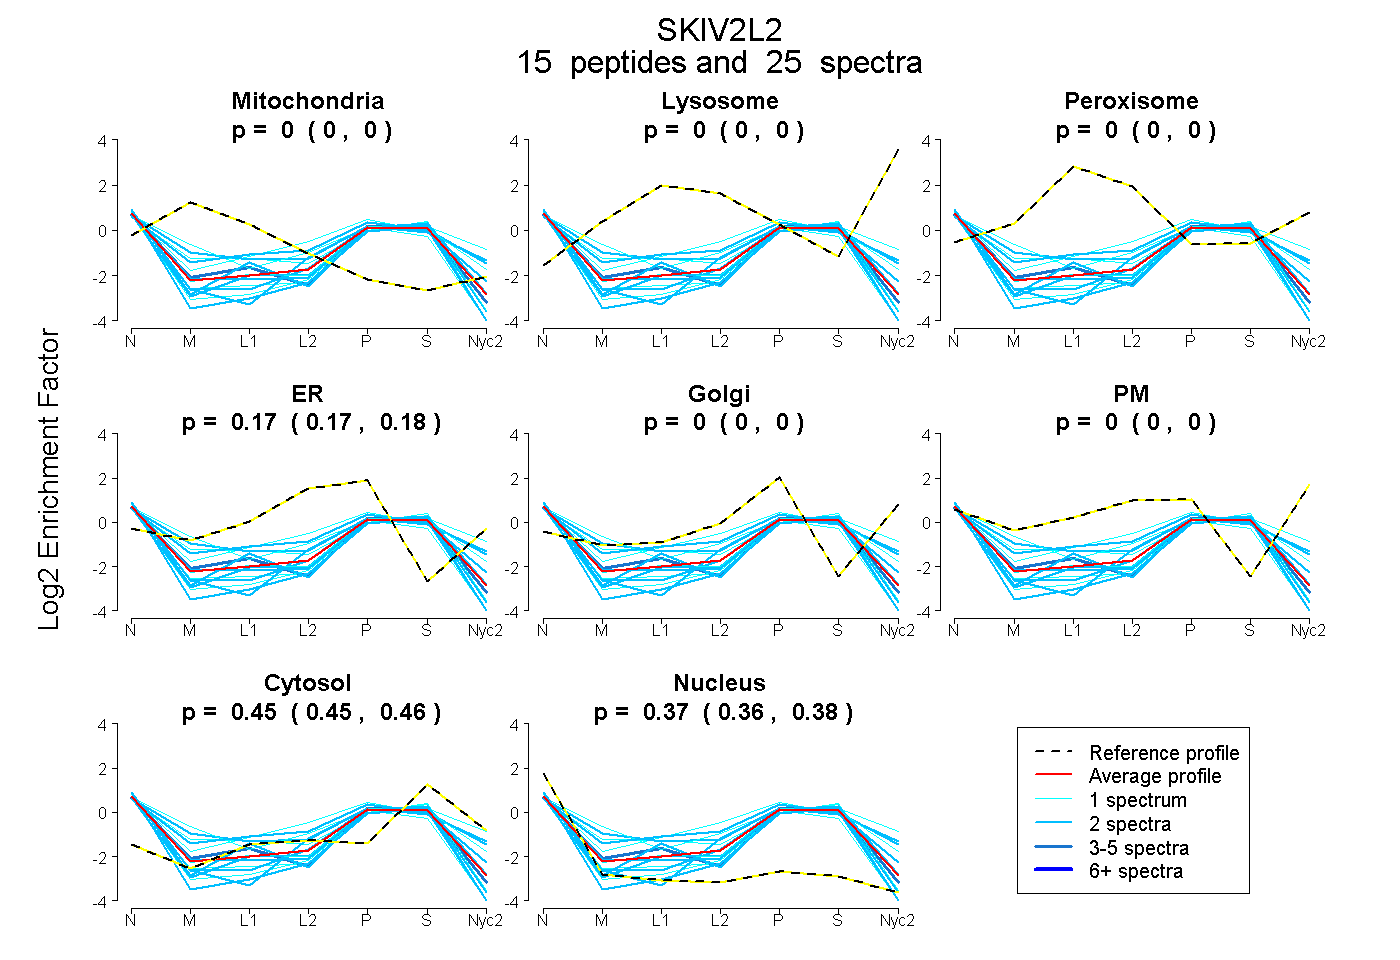
0.000 | 0.000
0.000 | 0.000
0.000 | 0.000
0.167 | 0.182
0.000 | 0.000
0.000 | 0.000
0.446 | 0.458
0.363 | 0.380
| Plot | Mito | Lyso | Perox | ER | Golgi | PM | Cytosol | Nucleus | |||||
| Expt A |
15 peptides |
25 spectra |
|
0.000 0.000 | 0.000 |
0.000 0.000 | 0.000 |
0.000 0.000 | 0.000 |
0.175 0.167 | 0.182 |
0.000 0.000 | 0.000 |
0.000 0.000 | 0.000 |
0.453 0.446 | 0.458 |
0.372 0.363 | 0.380 |
| 2 spectra, QFAEWICHLHK | 0.000 | 0.000 | 0.000 | 0.116 | 0.000 | 0.000 | 0.391 | 0.493 | ||
| 2 spectra, GPSNVFK | 0.087 | 0.000 | 0.000 | 0.069 | 0.211 | 0.058 | 0.407 | 0.168 | ||
| 1 spectrum, EIEEYIHKPK | 0.000 | 0.000 | 0.000 | 0.033 | 0.000 | 0.000 | 0.476 | 0.491 | ||
| 2 spectra, VEEINPEYMLEK | 0.000 | 0.000 | 0.000 | 0.108 | 0.000 | 0.000 | 0.518 | 0.374 | ||
| 3 spectra, LDFNTDEEK | 0.000 | 0.000 | 0.000 | 0.132 | 0.000 | 0.000 | 0.460 | 0.408 | ||
| 2 spectra, VEAFEHR | 0.000 | 0.000 | 0.000 | 0.000 | 0.000 | 0.000 | 0.445 | 0.555 | ||
| 1 spectrum, MTDVFEGSIIR | 0.000 | 0.000 | 0.000 | 0.012 | 0.000 | 0.000 | 0.525 | 0.464 | ||
| 2 spectra, LGFATSSDVIEMK | 0.000 | 0.000 | 0.000 | 0.110 | 0.000 | 0.000 | 0.451 | 0.439 | ||
| 1 spectrum, VIFTSPIK | 0.000 | 0.000 | 0.000 | 0.000 | 0.238 | 0.000 | 0.454 | 0.308 | ||
| 2 spectra, TVLQMDELK | 0.000 | 0.000 | 0.001 | 0.333 | 0.000 | 0.037 | 0.455 | 0.173 | ||
| 1 spectrum, AIPGVVEK | 0.015 | 0.000 | 0.000 | 0.000 | 0.128 | 0.200 | 0.496 | 0.161 | ||
| 2 spectra, NSEEQYNK | 0.000 | 0.000 | 0.000 | 0.001 | 0.200 | 0.000 | 0.421 | 0.378 | ||
| 2 spectra, YCLPFLQPGR | 0.000 | 0.000 | 0.000 | 0.094 | 0.000 | 0.000 | 0.415 | 0.491 | ||
| 1 spectrum, EVAWVIFDEIHYMR | 0.000 | 0.000 | 0.000 | 0.399 | 0.000 | 0.000 | 0.438 | 0.163 | ||
| 1 spectrum, LPQVEHVLPLLK | 0.159 | 0.000 | 0.000 | 0.238 | 0.000 | 0.000 | 0.261 | 0.342 |
| Plot | Mito | Lyso or Perox | ER | Golgi | PM | Cytosol | Nucleus | ||||||
| Expt B |
4 peptides |
6 spectra |
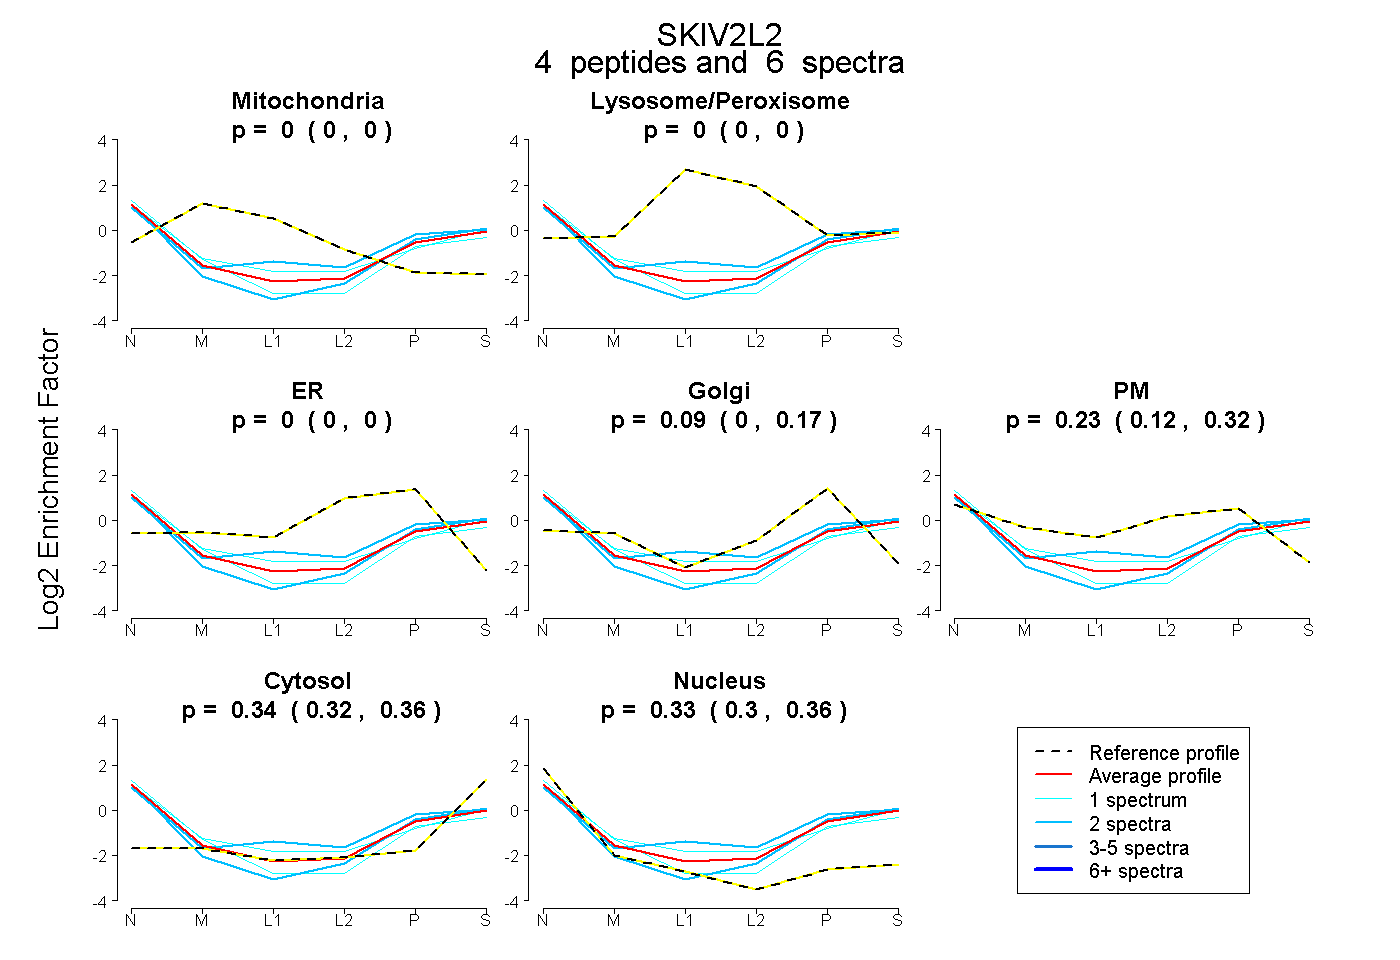 |
0.000 0.000 | 0.000 |
0.000 0.000 | 0.000 |
0.000 0.000 | 0.000 |
0.094 0.000 | 0.173 |
0.229 0.124 | 0.323 |
0.343 0.323 | 0.359 |
0.334 0.301 | 0.361 |
|||
| Plot | Lyso | Other | |||||||||||
| Expt C |
1 peptide |
1 spectrum |
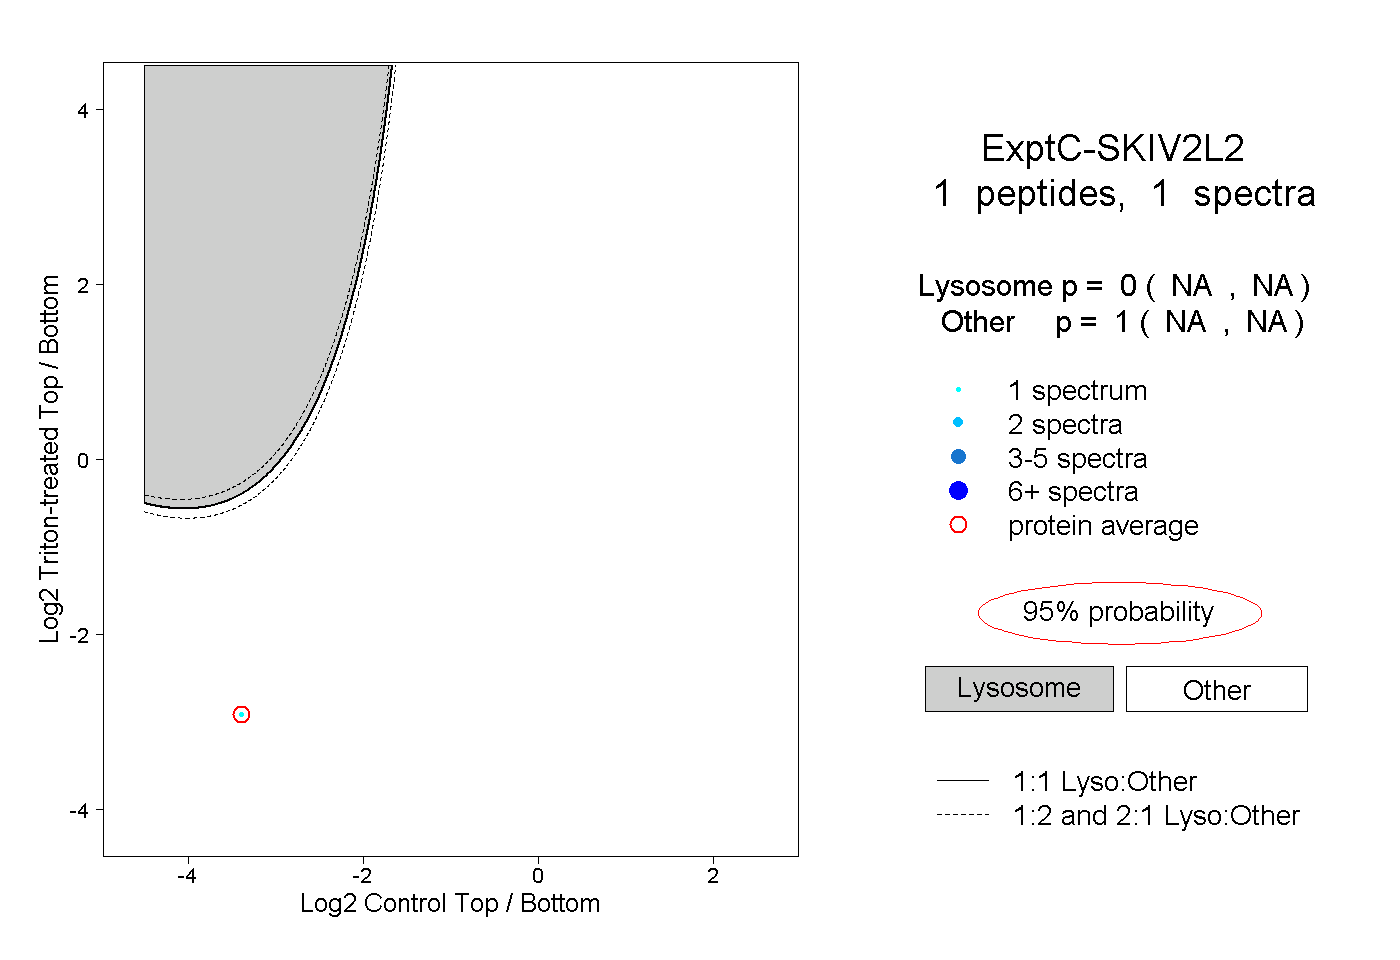 |
0.000 NA | NA |
1.000 NA | NA |