 9
9peptides
spectra
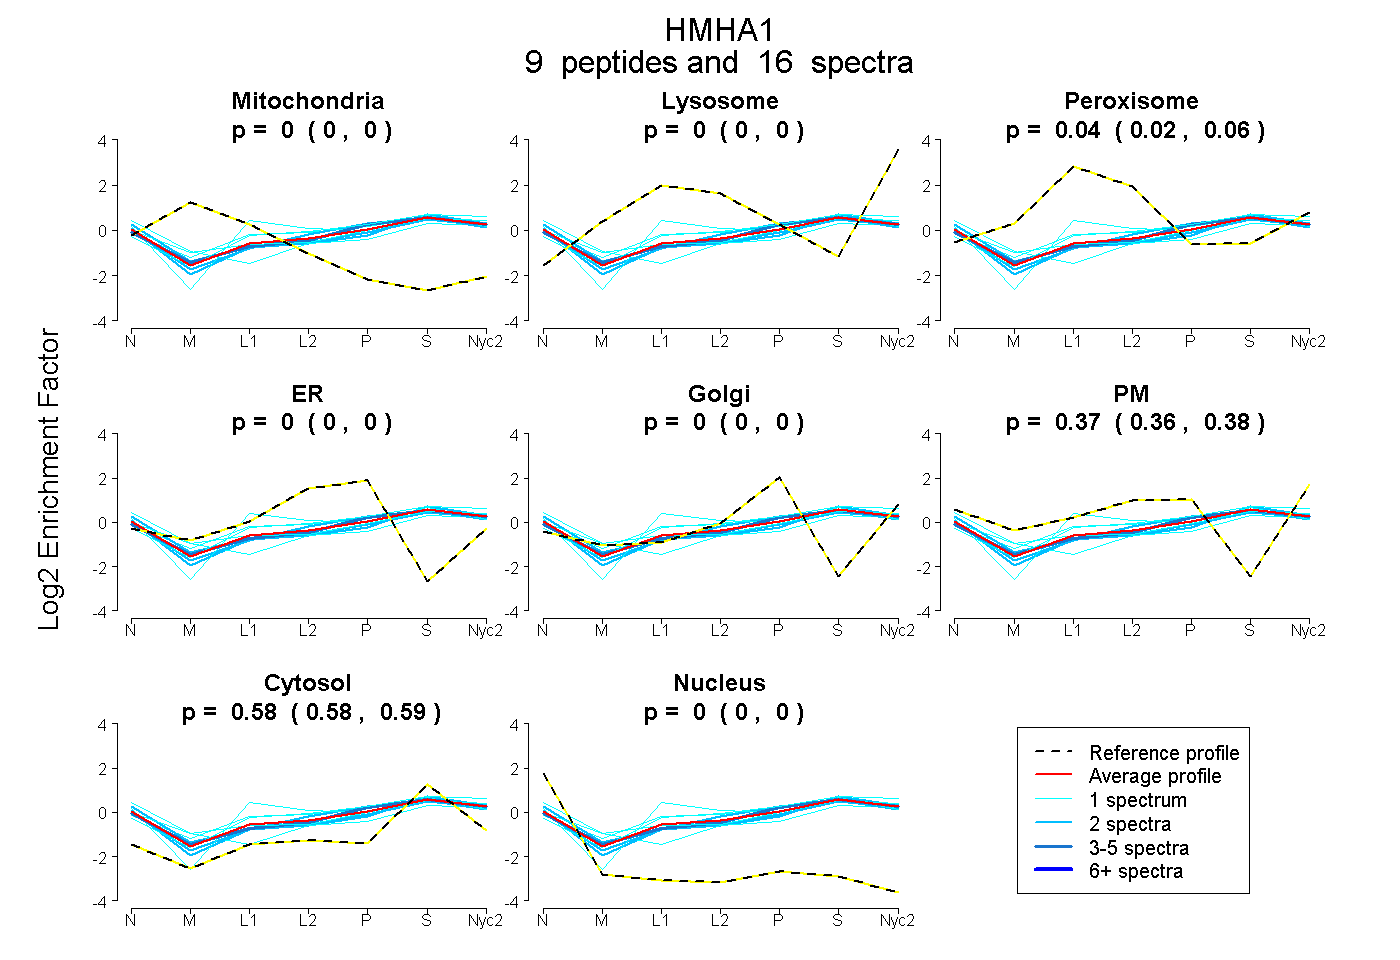
0.000 | 0.000
0.000 | 0.000
0.025 | 0.058
0.000 | 0.000
0.000 | 0.000
0.361 | 0.384
0.575 | 0.591
0.000 | 0.000
1peptide
spectra
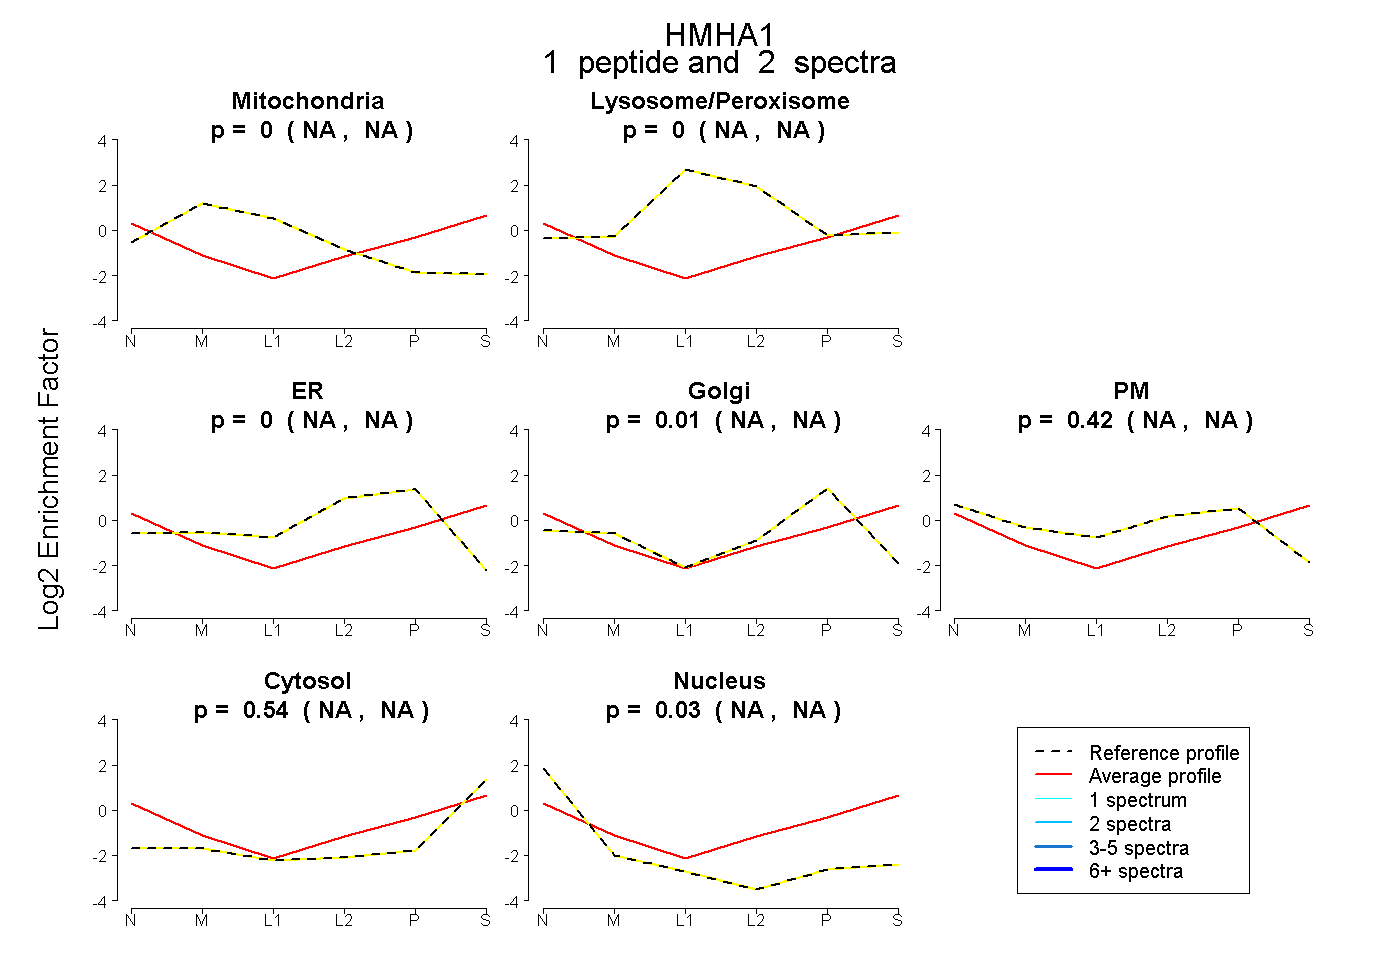
NA | NA
NA | NA
NA | NA
NA | NA
NA | NA
NA | NA
NA | NA
6peptides
spectra
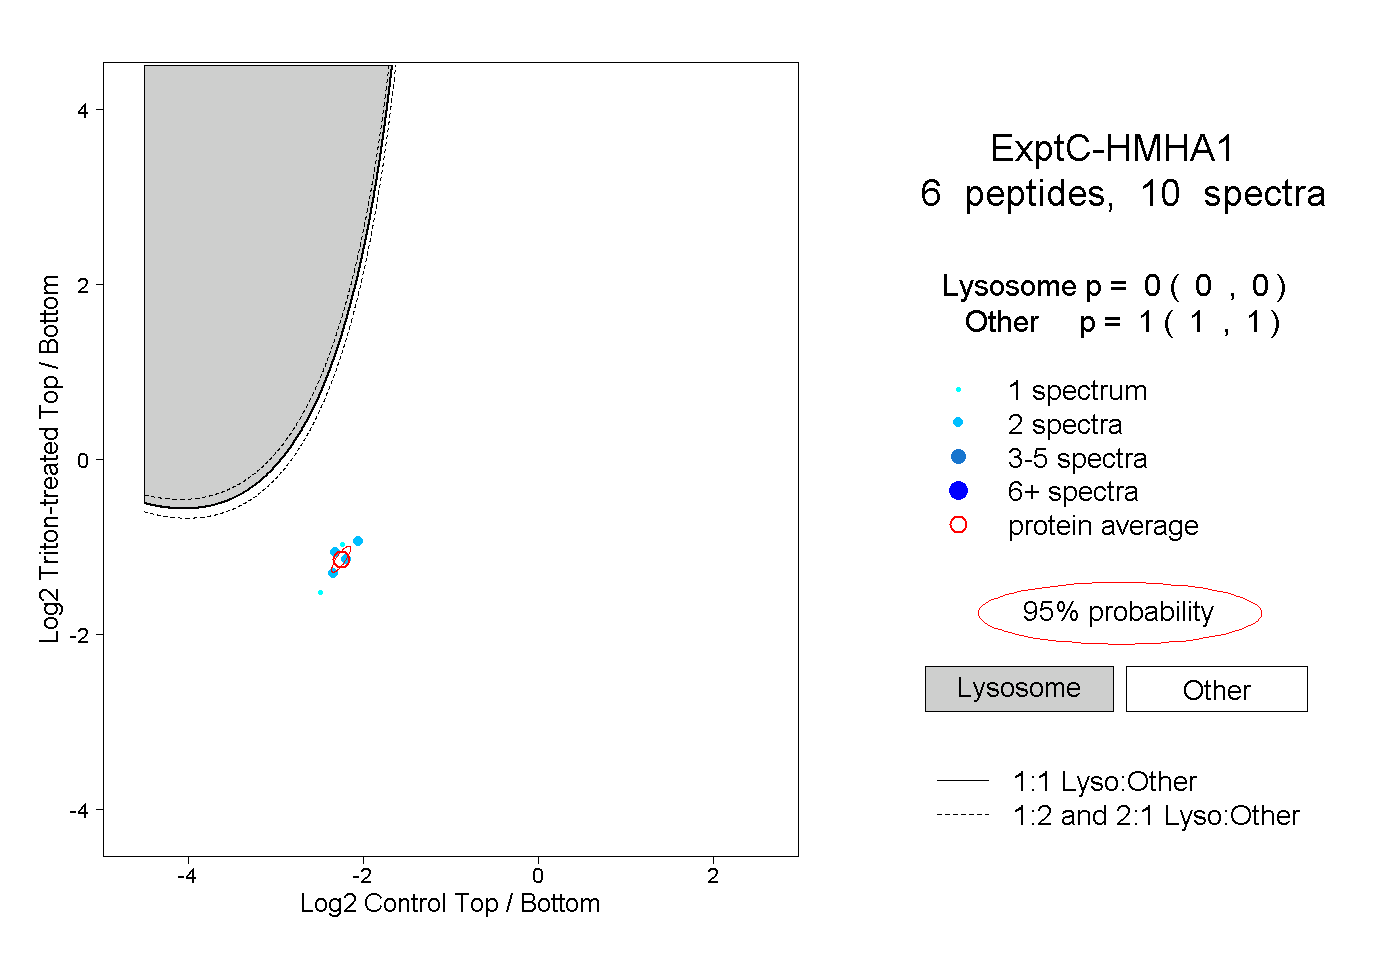
0.000 | 0.000
1.000 | 1.000
1peptide
spectrum
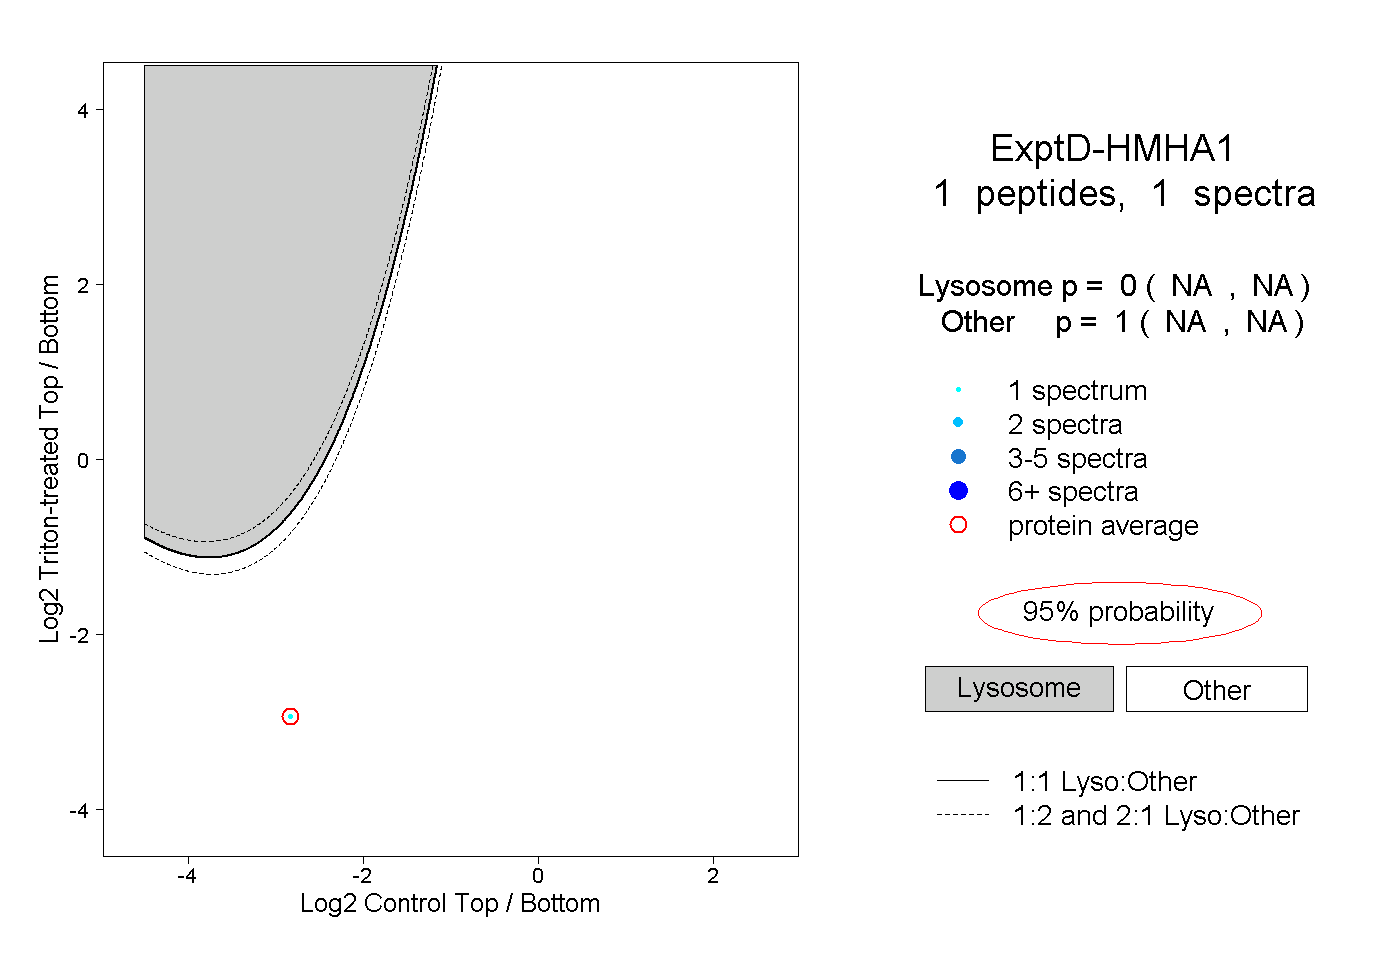
NA | NA
NA | NA