 9
9peptides
spectra
0.000 | 0.000
0.000 | 0.000
0.025 | 0.058
0.000 | 0.000
0.000 | 0.000
0.361 | 0.384
0.575 | 0.591
0.000 | 0.000
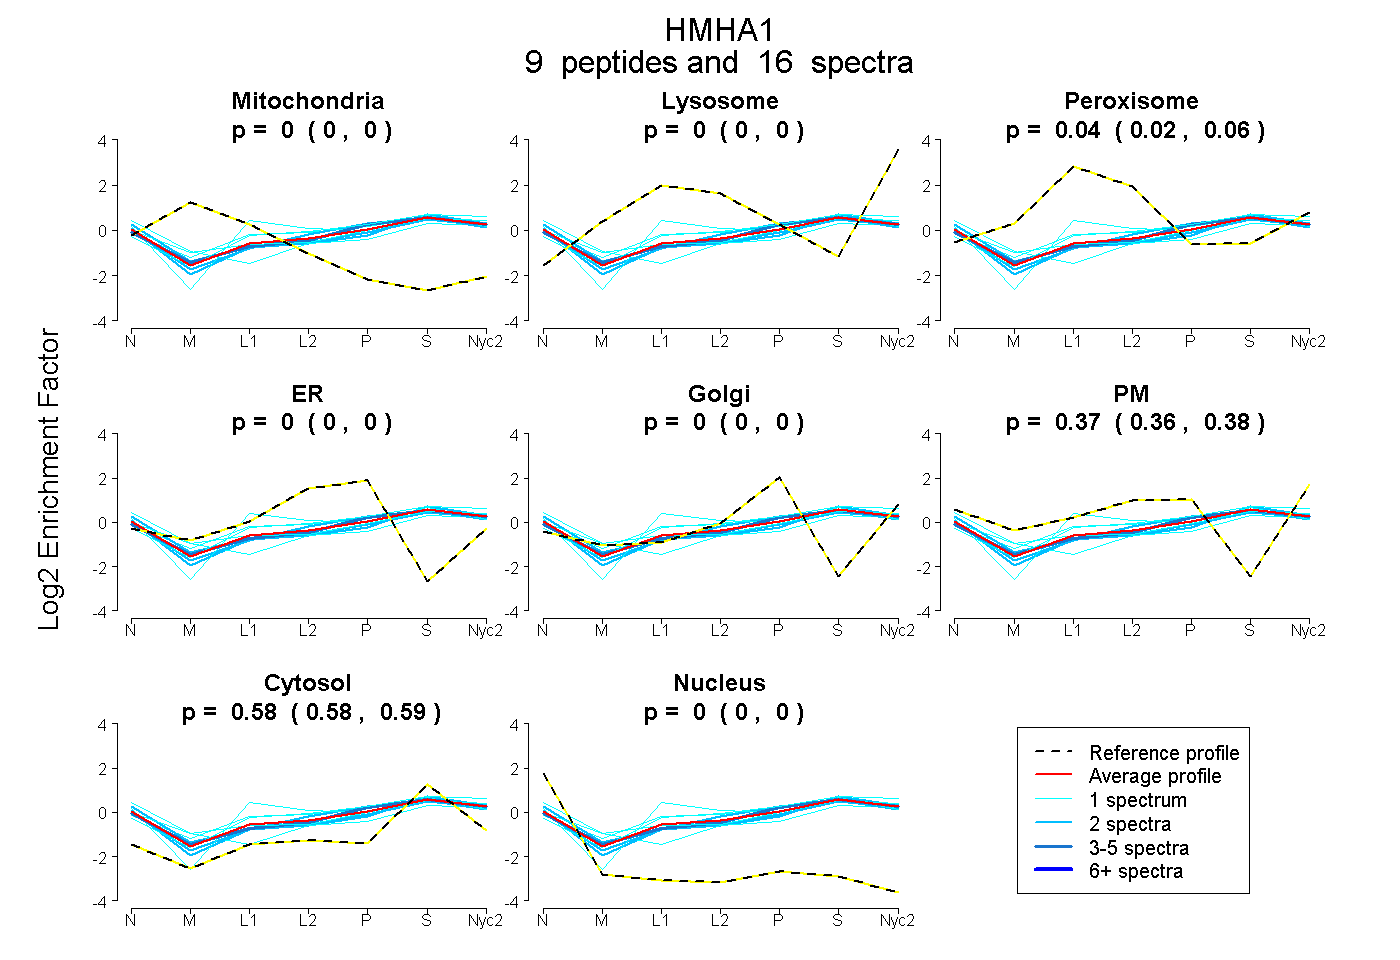
| Plot | Mito | Lyso | Perox | ER | Golgi | PM | Cytosol | Nucleus | |||||
| Expt A |
9 peptides |
16 spectra |
|
0.000 0.000 | 0.000 |
0.000 0.000 | 0.000 |
0.043 0.025 | 0.058 |
0.000 0.000 | 0.000 |
0.000 0.000 | 0.000 |
0.374 0.361 | 0.384 |
0.583 0.575 | 0.591 |
0.000 0.000 | 0.000 |
| 5 spectra, IVEMEQDNK | 0.000 | 0.000 | 0.003 | 0.000 | 0.000 | 0.407 | 0.590 | 0.000 | ||
| 1 spectrum, GHQVHK | 0.000 | 0.000 | 0.212 | 0.000 | 0.000 | 0.229 | 0.559 | 0.000 | ||
| 1 spectrum, AEEAMATYR | 0.000 | 0.000 | 0.179 | 0.000 | 0.038 | 0.270 | 0.513 | 0.000 | ||
| 1 spectrum, QLPEPLISFR | 0.000 | 0.000 | 0.057 | 0.000 | 0.000 | 0.388 | 0.555 | 0.000 | ||
| 1 spectrum, DLIGYLEK | 0.000 | 0.000 | 0.000 | 0.000 | 0.000 | 0.401 | 0.545 | 0.054 | ||
| 2 spectra, ATLLYLLR | 0.000 | 0.000 | 0.000 | 0.000 | 0.000 | 0.345 | 0.655 | 0.000 | ||
| 2 spectra, DDLLEAR | 0.000 | 0.000 | 0.001 | 0.000 | 0.000 | 0.410 | 0.589 | 0.000 | ||
| 2 spectra, FAEGLEK | 0.000 | 0.000 | 0.000 | 0.022 | 0.000 | 0.387 | 0.590 | 0.000 | ||
| 1 spectrum, QIQEVIR | 0.000 | 0.097 | 0.067 | 0.000 | 0.000 | 0.292 | 0.544 | 0.000 |
| Plot | Mito | Lyso or Perox | ER | Golgi | PM | Cytosol | Nucleus | ||||||
| Expt B |
1 peptide |
2 spectra |
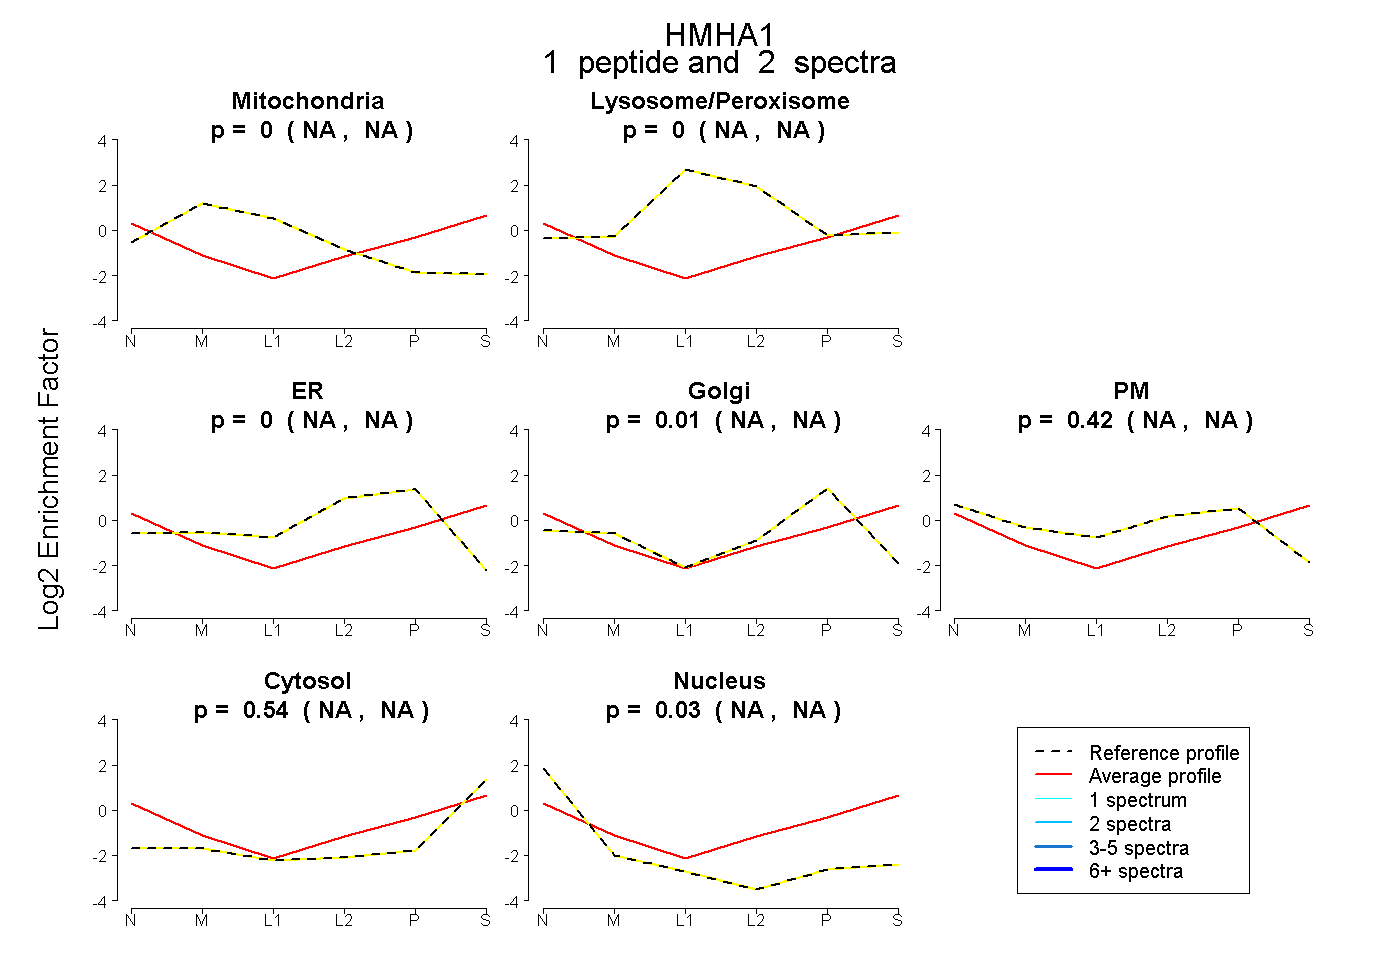 |
0.000 NA | NA |
0.000 NA | NA |
0.000 NA | NA |
0.010 NA | NA |
0.416 NA | NA |
0.541 NA | NA |
0.032 NA | NA |
|||
| Plot | Lyso | Other | |||||||||||
| Expt C |
6 peptides |
10 spectra |
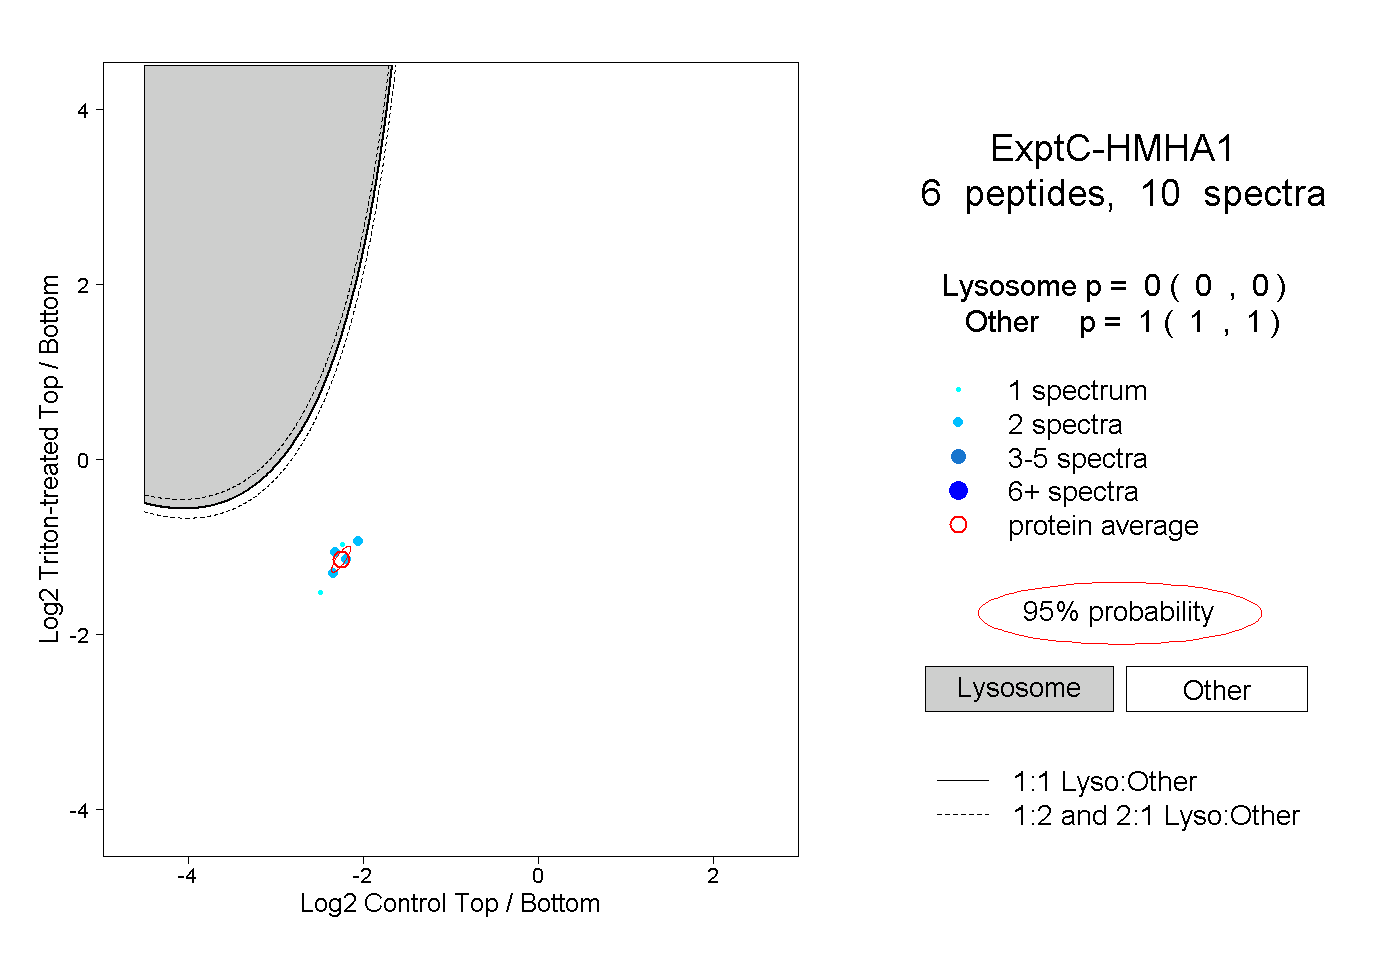 |
0.000 0.000 | 0.000 |
1.000 1.000 | 1.000 |
||||||||
| Plot | Lyso | Other | |||||||||||
| Expt D |
1 peptide |
1 spectrum |
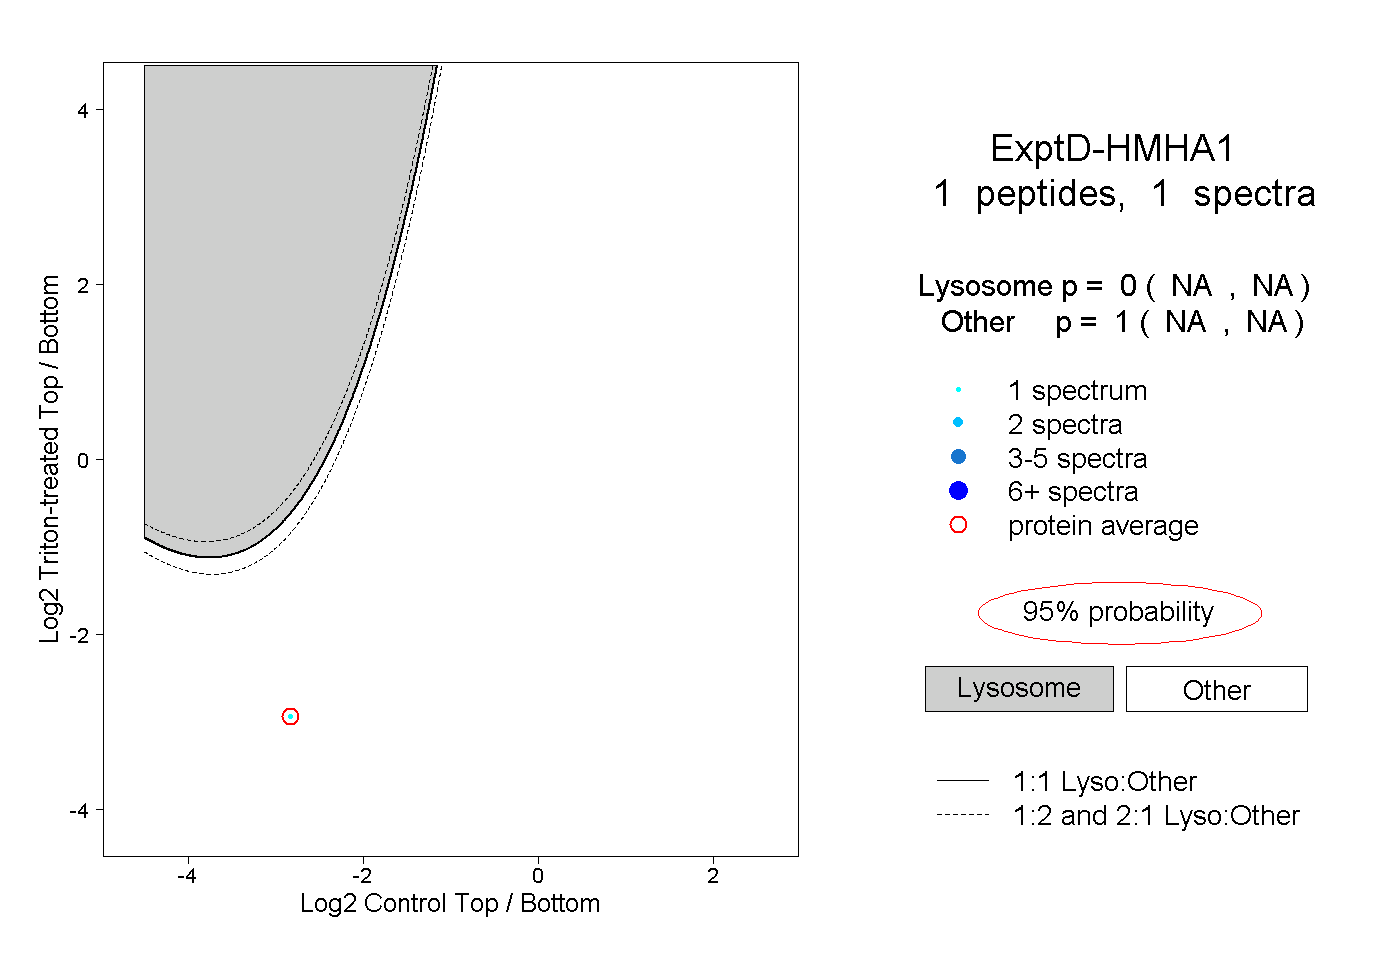 |
0.000 NA | NA |
1.000 NA | NA |