 12
12peptides
spectra
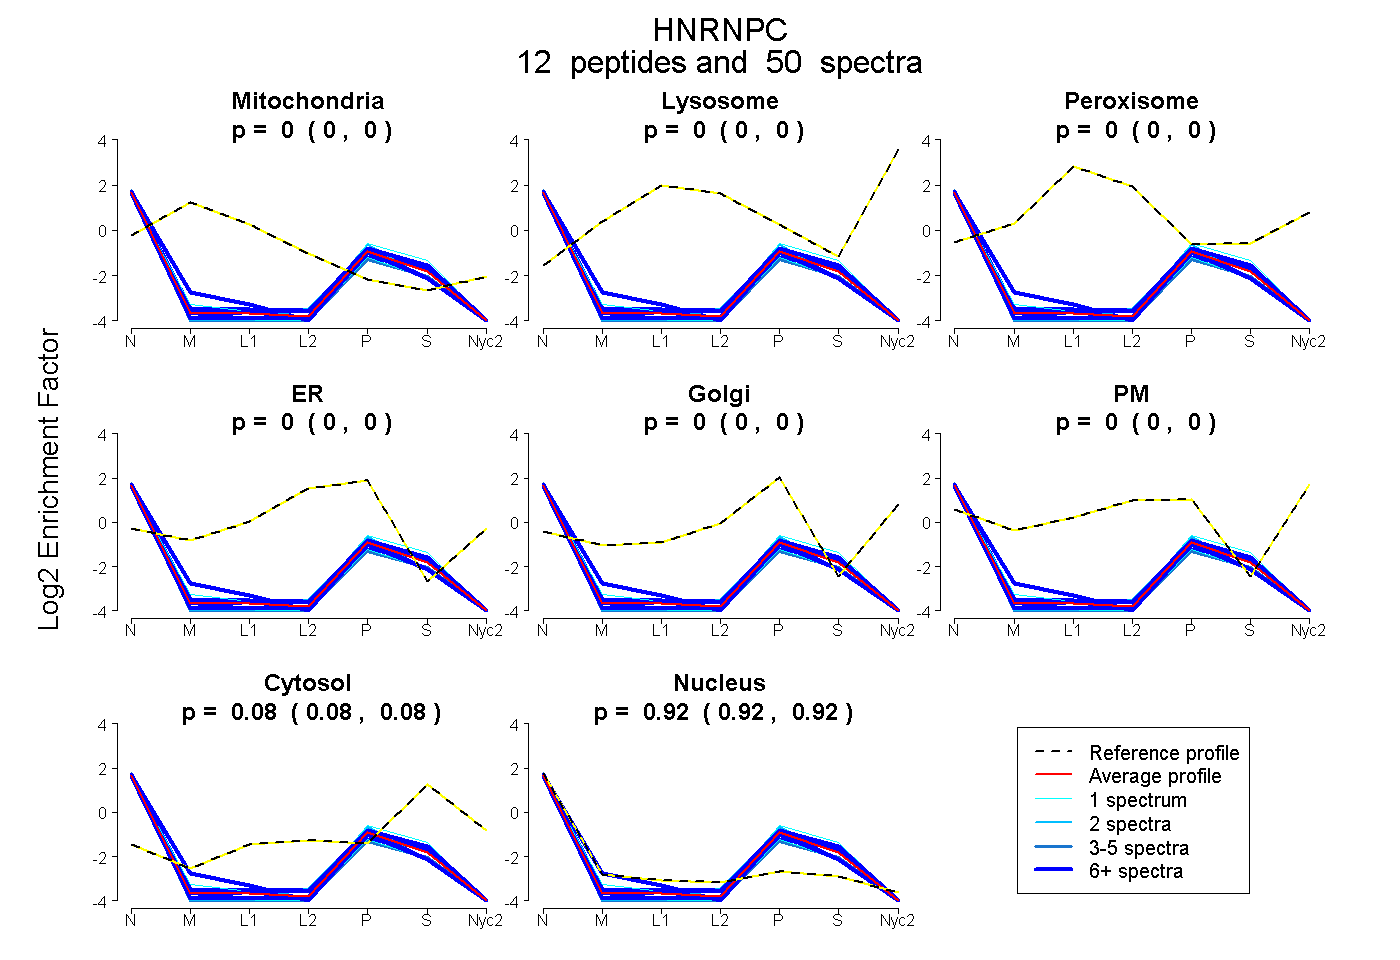
0.000 | 0.000
0.000 | 0.000
0.000 | 0.000
0.000 | 0.000
0.000 | 0.000
0.000 | 0.000
0.079 | 0.083
0.917 | 0.921
3peptides
spectra
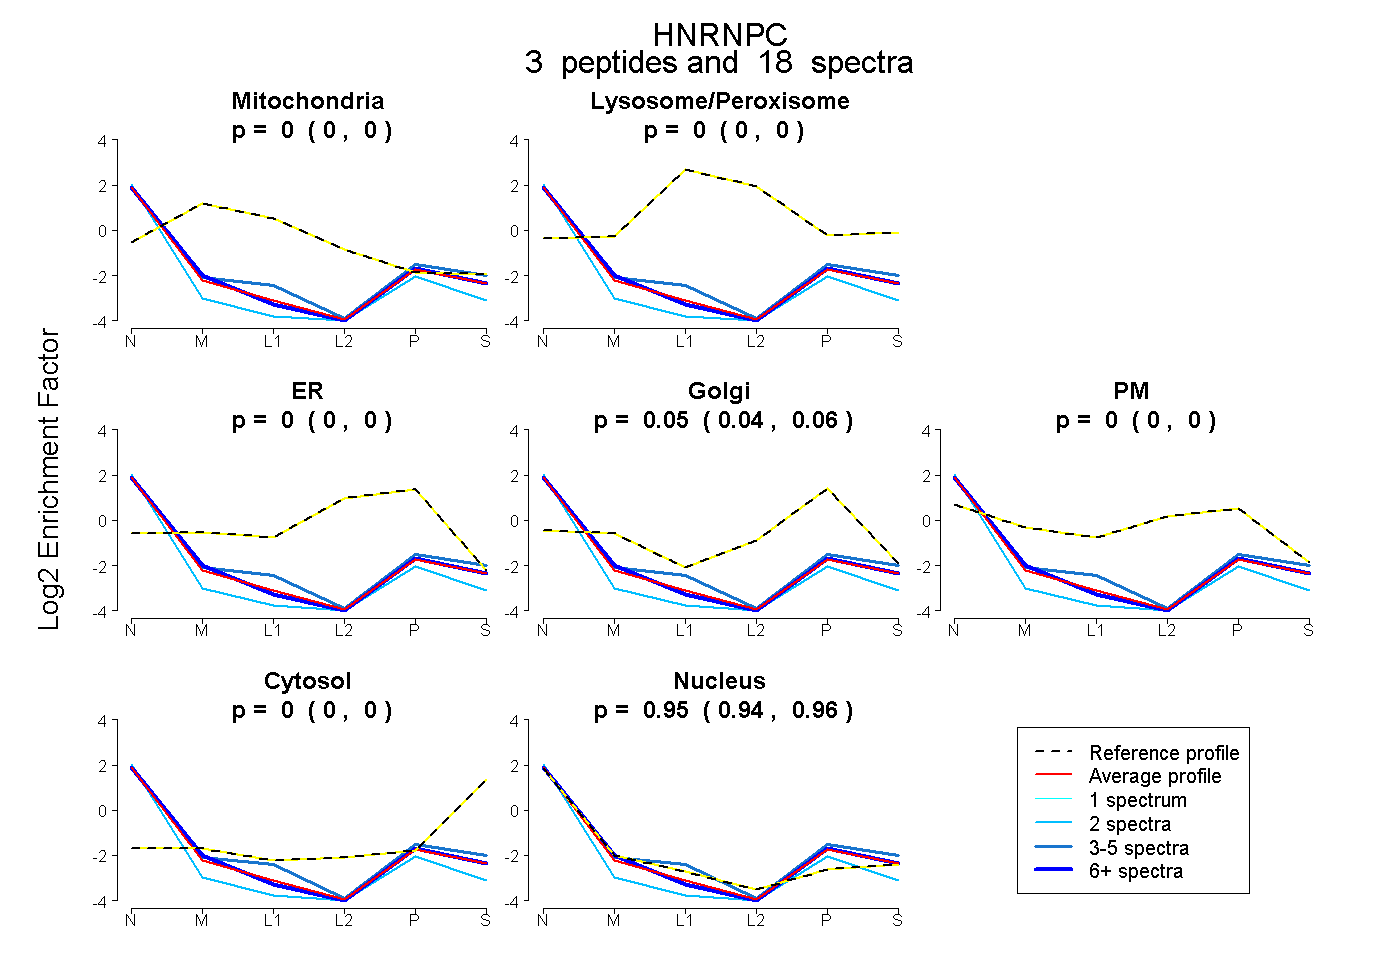
0.000 | 0.000
0.000 | 0.000
0.000 | 0.000
0.040 | 0.059
0.000 | 0.000
0.000 | 0.000
0.939 | 0.958
1peptide
spectrum
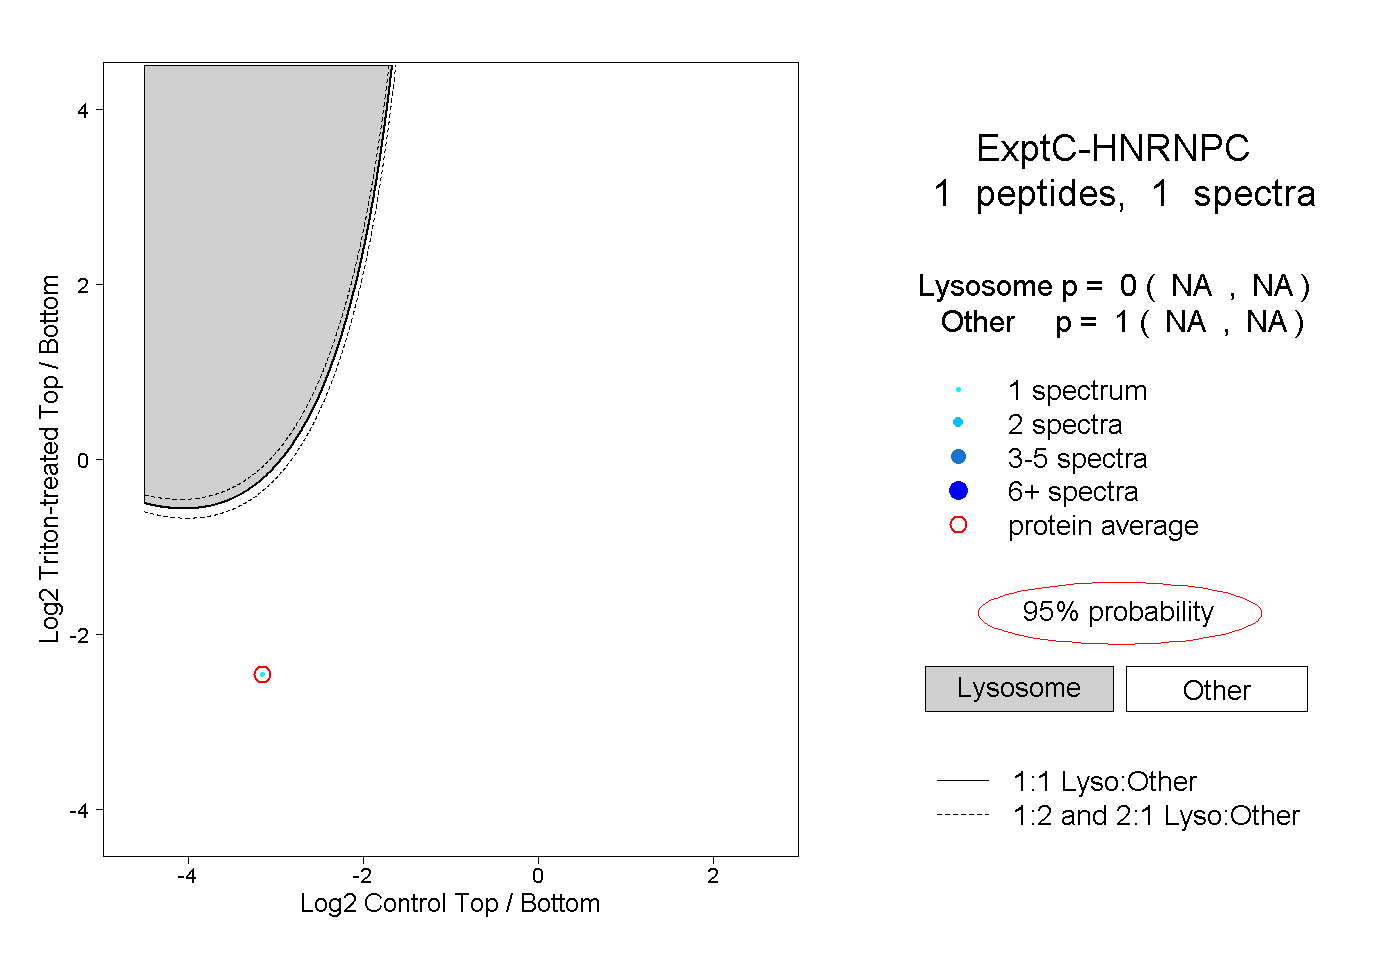
NA | NA
NA | NA
1peptide
spectrum
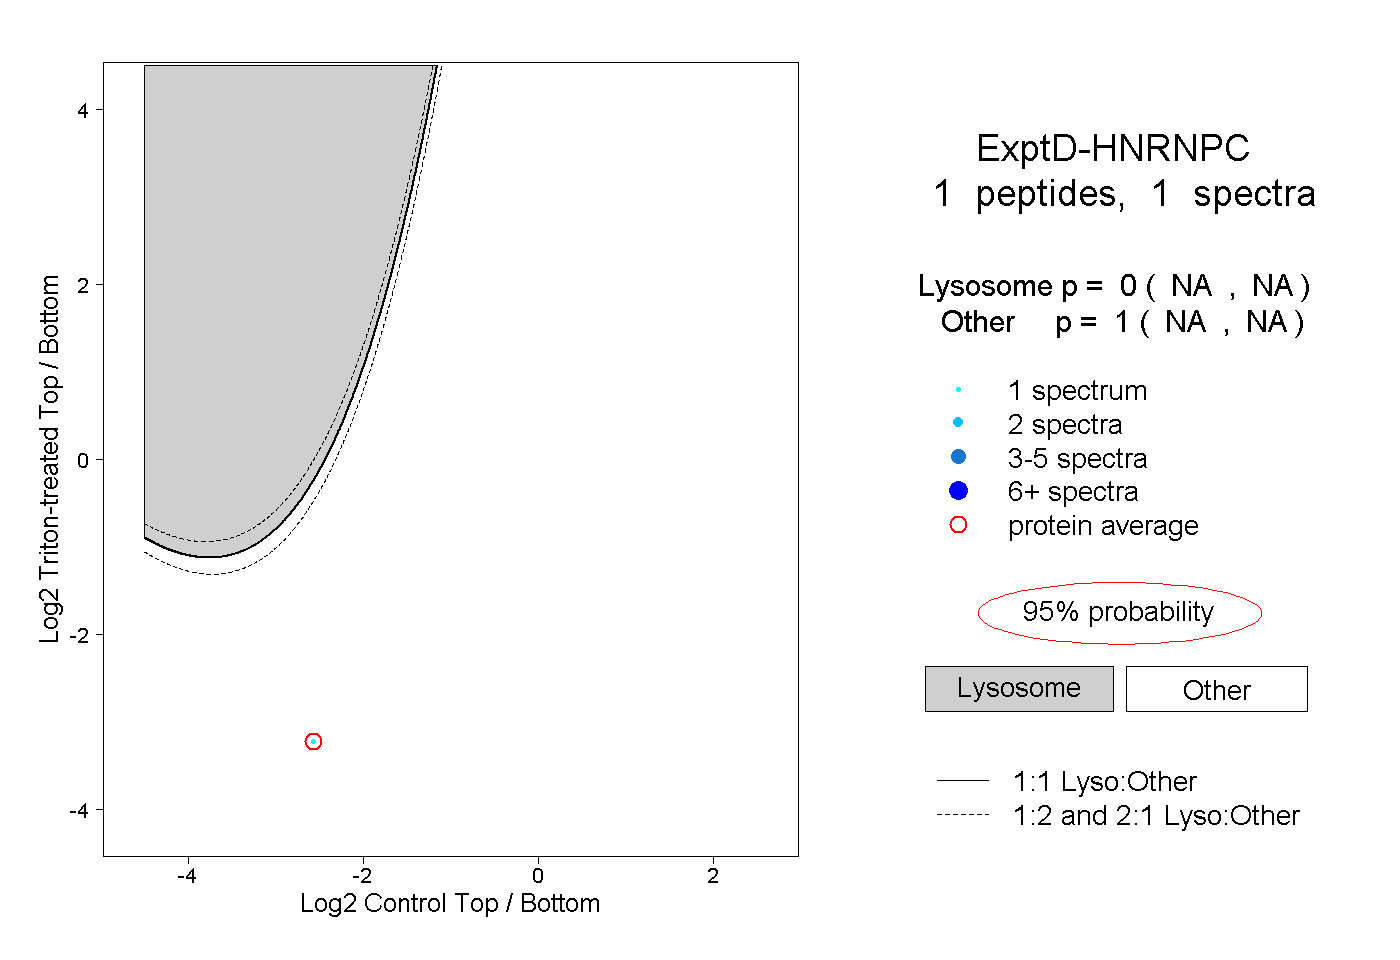
NA | NA
NA | NA