 12
12peptides
spectra
0.000 | 0.000
0.000 | 0.000
0.000 | 0.000
0.000 | 0.000
0.000 | 0.000
0.000 | 0.000
0.079 | 0.083
0.917 | 0.921
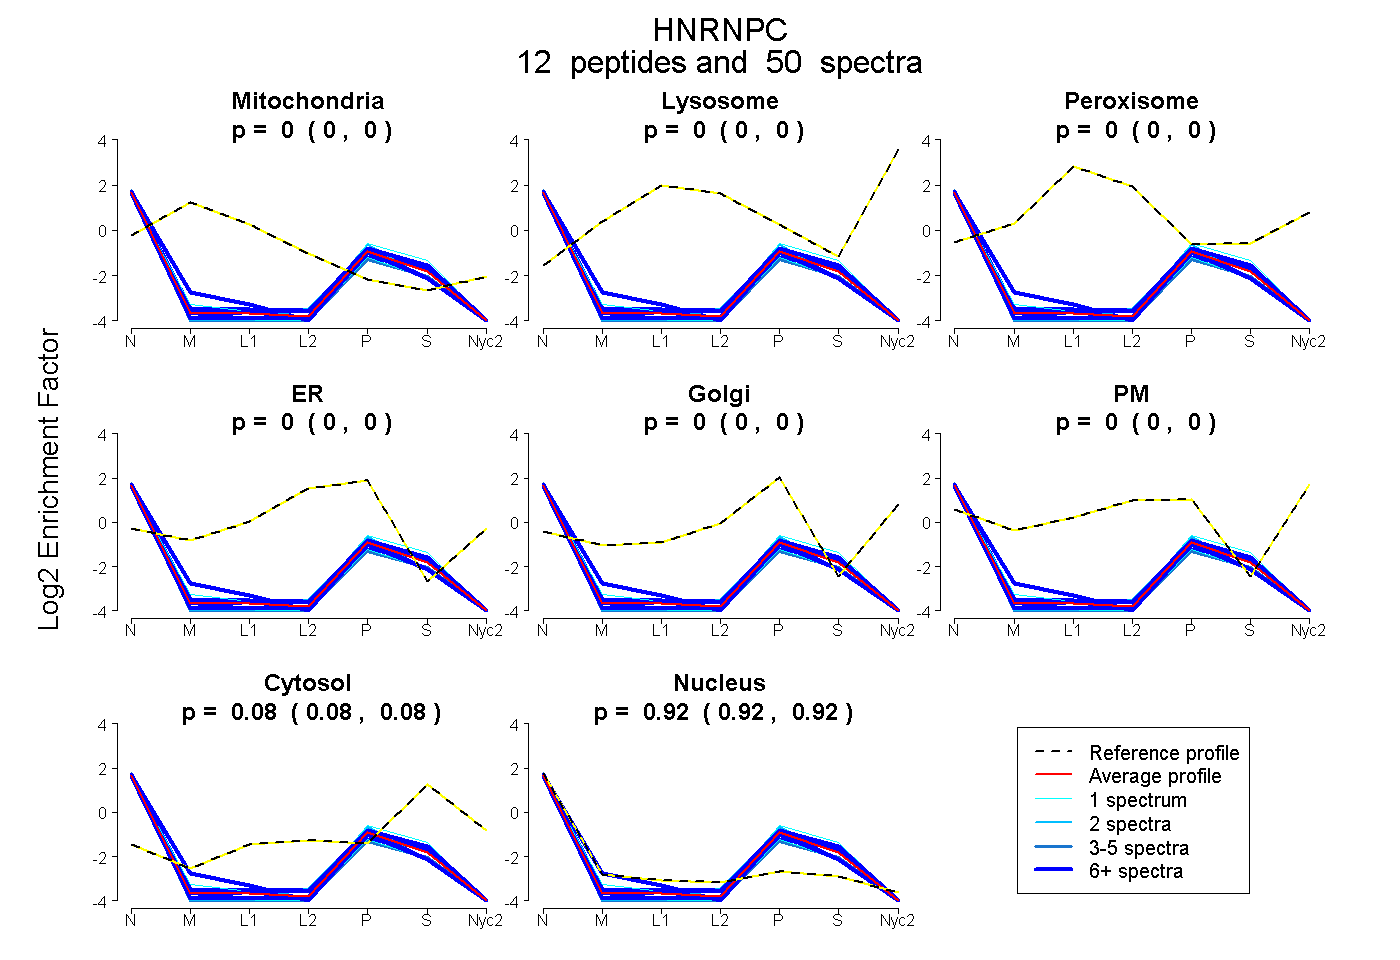
| Plot | Mito | Lyso | Perox | ER | Golgi | PM | Cytosol | Nucleus | |||||
| Expt A |
12 peptides |
50 spectra |
|
0.000 0.000 | 0.000 |
0.000 0.000 | 0.000 |
0.000 0.000 | 0.000 |
0.000 0.000 | 0.000 |
0.000 0.000 | 0.000 |
0.000 0.000 | 0.000 |
0.081 0.079 | 0.083 |
0.919 0.917 | 0.921 |
| 6 spectra, SGFNSK | 0.000 | 0.000 | 0.000 | 0.000 | 0.046 | 0.000 | 0.021 | 0.933 | ||
| 1 spectrum, SEEEQSSASVK | 0.000 | 0.000 | 0.000 | 0.000 | 0.000 | 0.000 | 0.012 | 0.988 | ||
| 3 spectra, SDVEAIFSK | 0.000 | 0.000 | 0.000 | 0.000 | 0.000 | 0.000 | 0.018 | 0.982 | ||
| 6 spectra, GFAFVQYVNER | 0.000 | 0.000 | 0.000 | 0.000 | 0.000 | 0.000 | 0.094 | 0.906 | ||
| 7 spectra, AAVAGEDGR | 0.000 | 0.000 | 0.000 | 0.000 | 0.000 | 0.000 | 0.115 | 0.885 | ||
| 1 spectrum, SAAEMYGSSFDLDYDFQR | 0.000 | 0.000 | 0.000 | 0.000 | 0.000 | 0.000 | 0.142 | 0.858 | ||
| 6 spectra, VSGNTSR | 0.000 | 0.000 | 0.000 | 0.000 | 0.000 | 0.000 | 0.038 | 0.962 | ||
| 3 spectra, MYSYPAR | 0.000 | 0.000 | 0.000 | 0.000 | 0.000 | 0.000 | 0.030 | 0.970 | ||
| 2 spectra, QADLSFSSPVEMK | 0.000 | 0.000 | 0.000 | 0.000 | 0.028 | 0.000 | 0.014 | 0.958 | ||
| 12 spectra, VPPPPPIAR | 0.000 | 0.000 | 0.000 | 0.000 | 0.000 | 0.000 | 0.123 | 0.877 | ||
| 2 spectra, VFIGNLNTLVVK | 0.000 | 0.000 | 0.000 | 0.000 | 0.000 | 0.000 | 0.114 | 0.886 | ||
| 1 spectrum, MIAGQVLDINLAAEPK | 0.000 | 0.000 | 0.000 | 0.000 | 0.000 | 0.000 | 0.027 | 0.973 |
| Plot | Mito | Lyso or Perox | ER | Golgi | PM | Cytosol | Nucleus | ||||||
| Expt B |
3 peptides |
18 spectra |
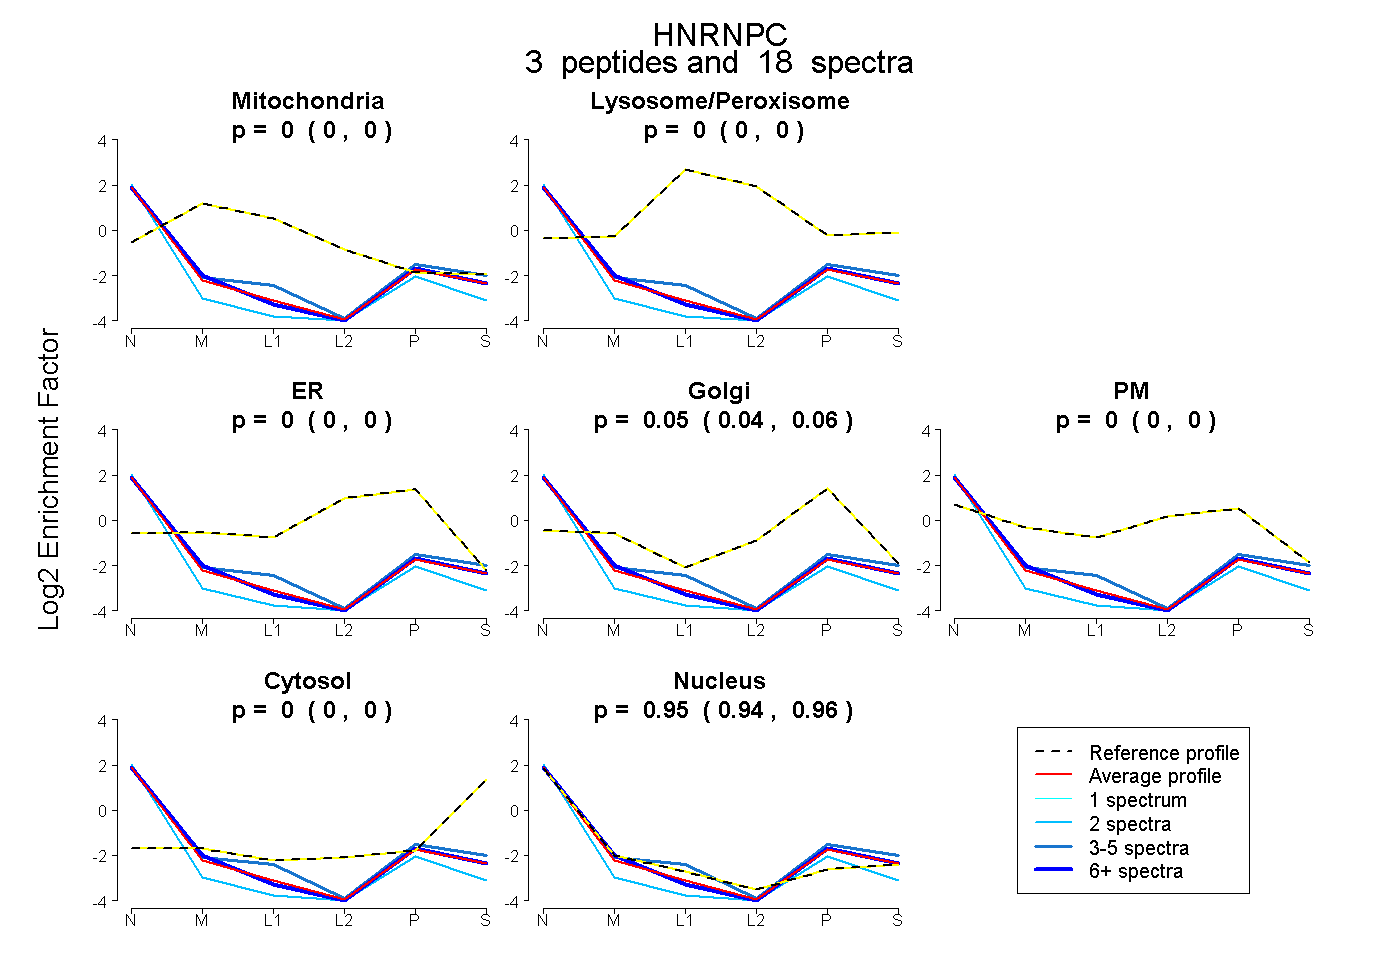 |
0.000 0.000 | 0.000 |
0.000 0.000 | 0.000 |
0.000 0.000 | 0.000 |
0.051 0.040 | 0.059 |
0.000 0.000 | 0.000 |
0.000 0.000 | 0.000 |
0.949 0.939 | 0.958 |
|||
| Plot | Lyso | Other | |||||||||||
| Expt C |
1 peptide |
1 spectrum |
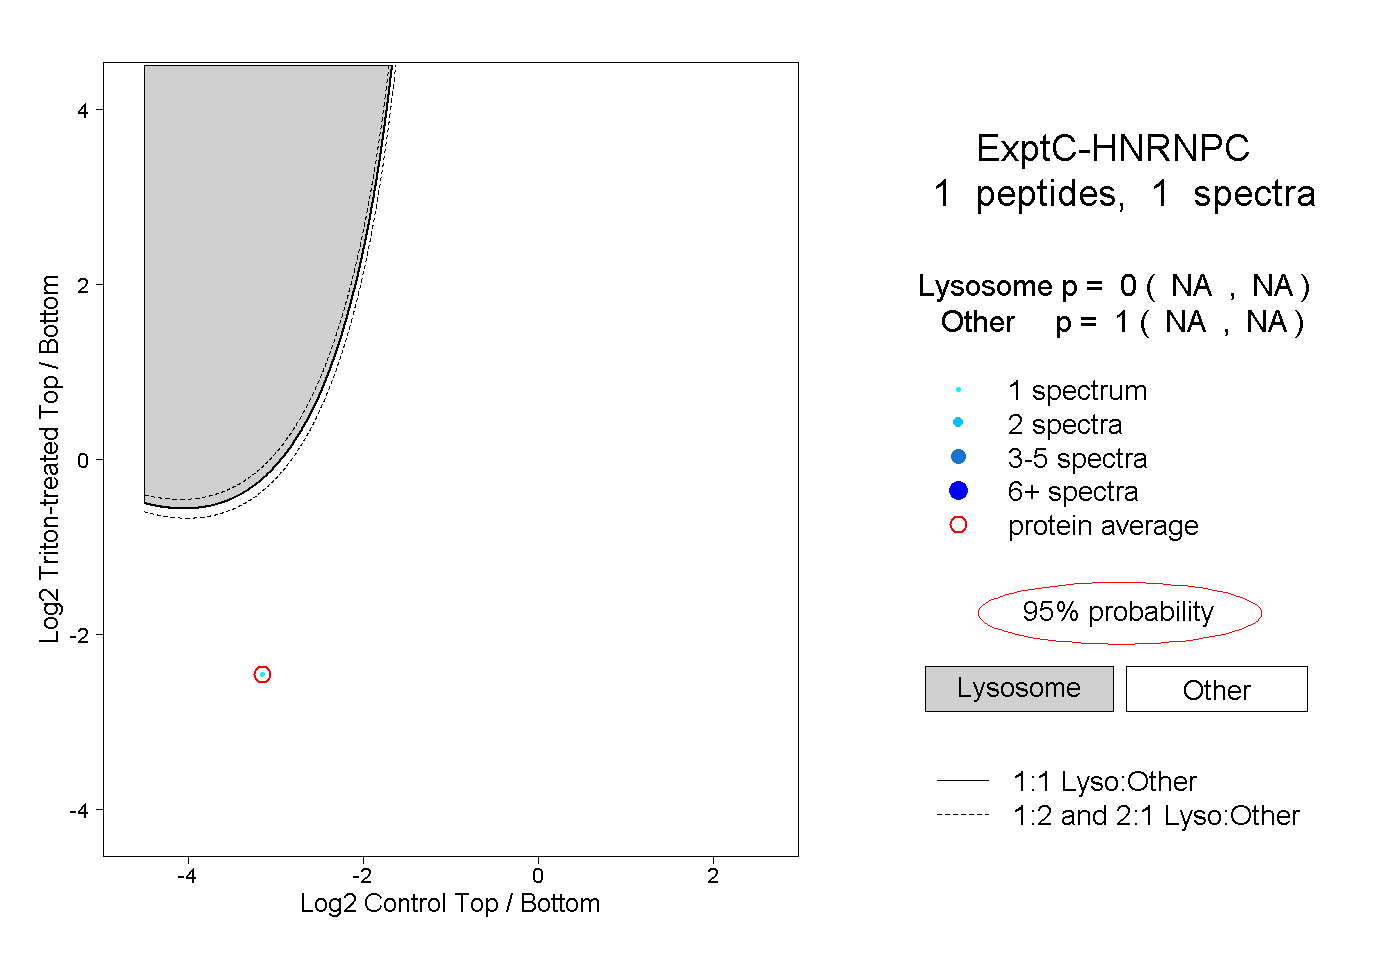 |
0.000 NA | NA |
1.000 NA | NA |
||||||||
| Plot | Lyso | Other | |||||||||||
| Expt D |
1 peptide |
1 spectrum |
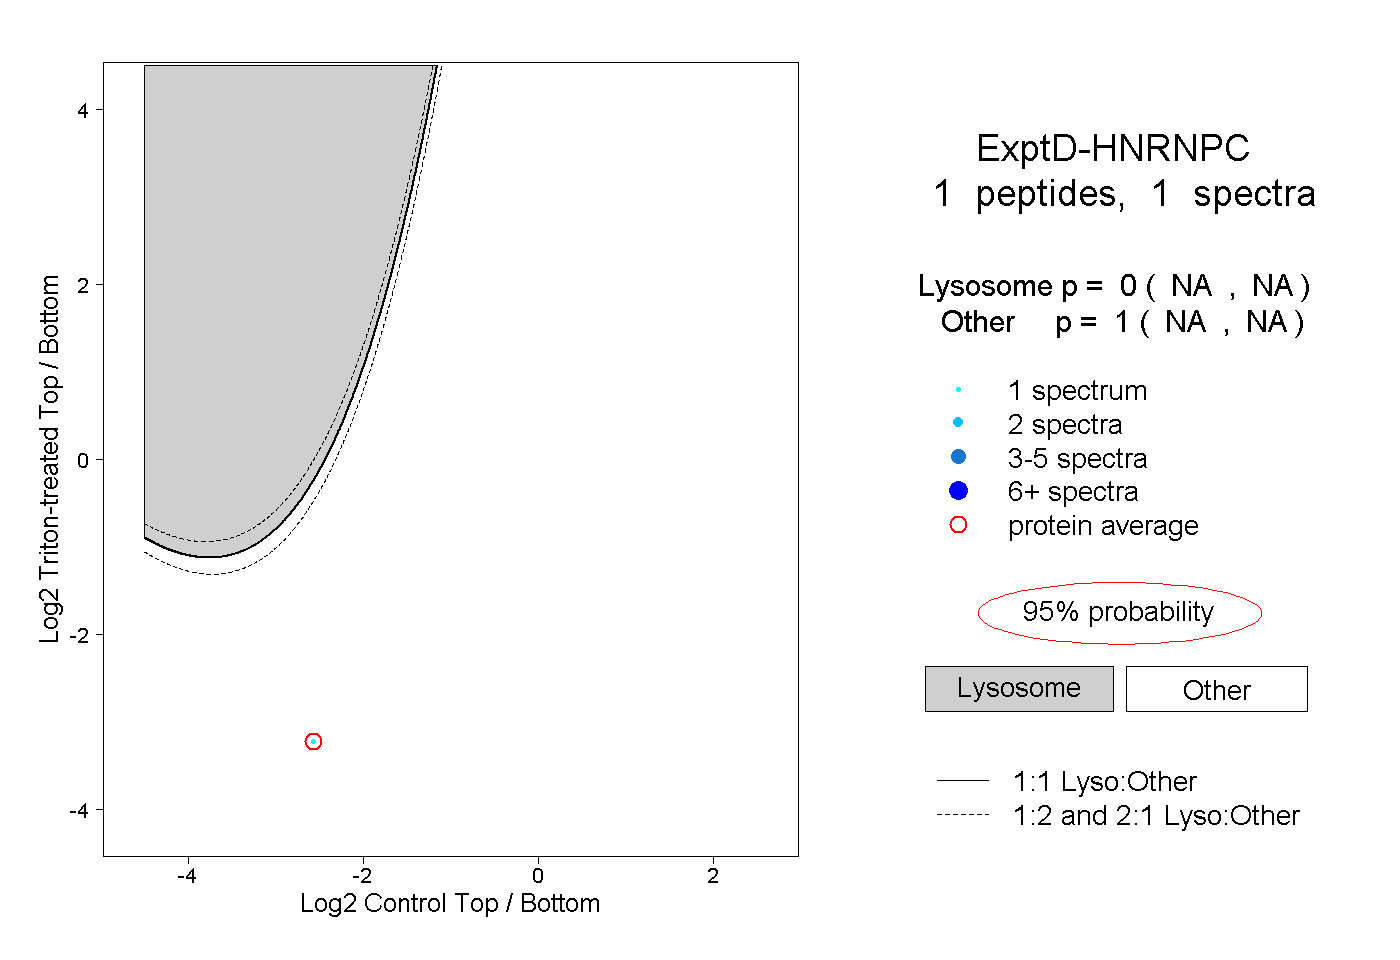 |
0.000 NA | NA |
1.000 NA | NA |