 14
14peptides
spectra
0.000 | 0.000
0.000 | 0.000
0.000 | 0.000
0.159 | 0.275
0.000 | 0.129
0.000 | 0.000
0.177 | 0.198
0.505 | 0.534
1peptide
spectrum

NA | NA
NA | NA
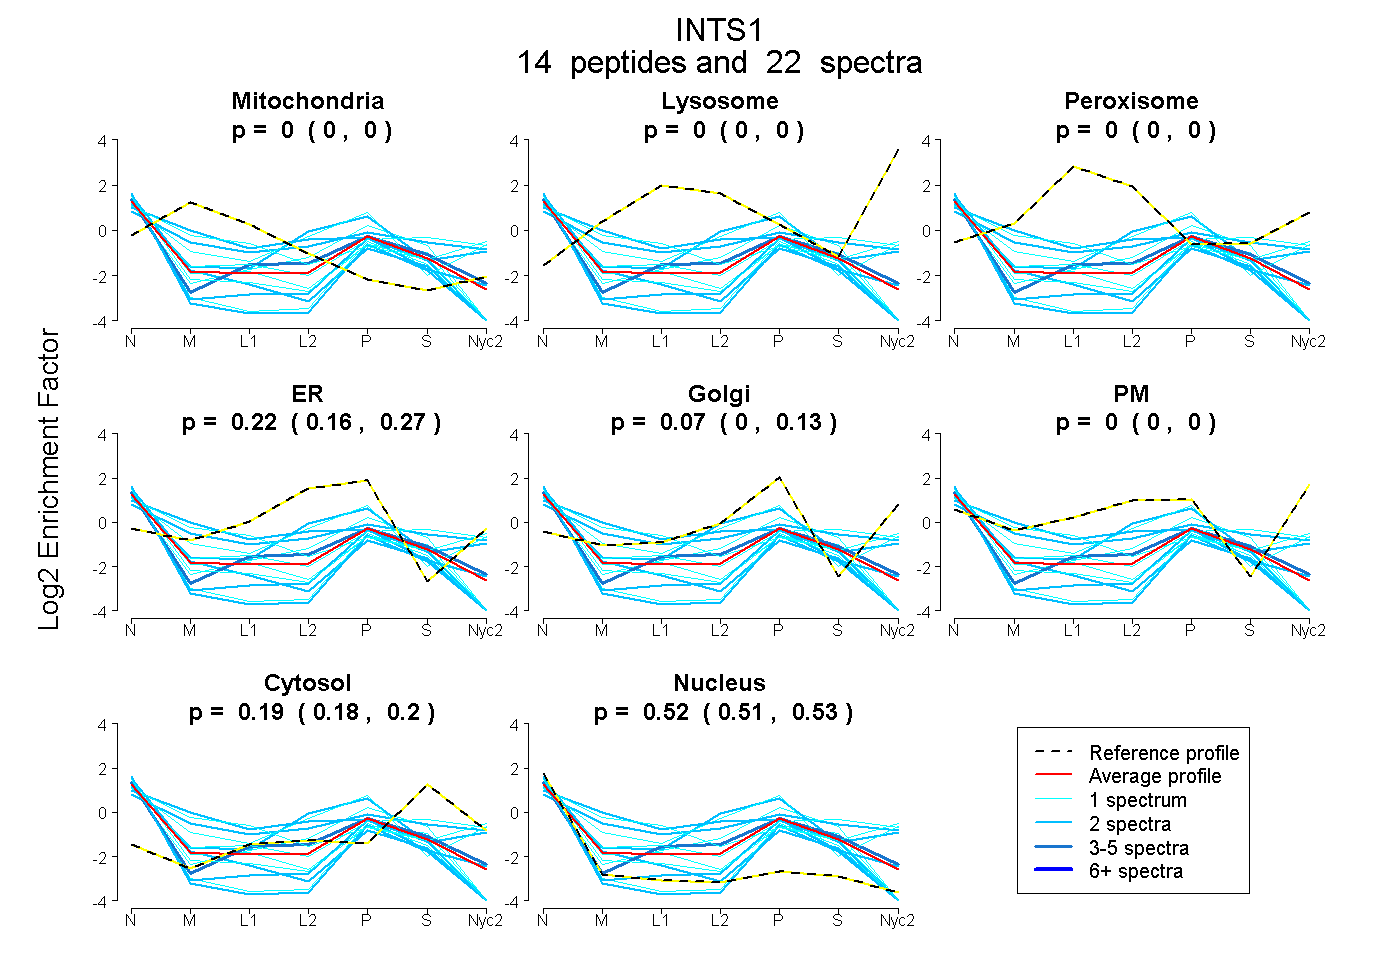
| Plot | Mito | Lyso | Perox | ER | Golgi | PM | Cytosol | Nucleus | |||||
| Expt A |
14 peptides |
22 spectra |
|
0.000 0.000 | 0.000 |
0.000 0.000 | 0.000 |
0.000 0.000 | 0.000 |
0.224 0.159 | 0.275 |
0.065 0.000 | 0.129 |
0.000 0.000 | 0.000 |
0.189 0.177 | 0.198 |
0.522 0.505 | 0.534 |
||
| Plot | Lyso | Other | |||||||||||
| Expt C |
1 peptide |
1 spectrum |
|
0.000 NA | NA |
1.000 NA | NA |